
Homework Answers


Add Answer to:
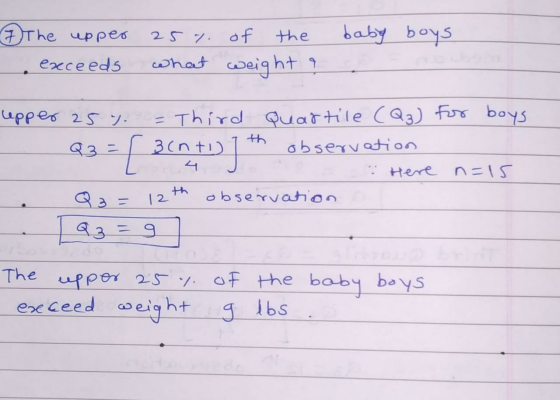
please answer number 6. 7. and 8. only
Birthweight for girls was compared to boys in...
Summarize/paraphrase this.. leave figures/data unchanged Seventy-three patients (47 boys [64%] and 26 girls [35%]; median age, 8...
Summarize/paraphrase this.. leave figures/data unchanged Seventy-three patients (47 boys [64%] and 26 girls [35%]; median age, 8 [interquartile range (IQR), 6-14] days) received treatment and completed the trial. No difference was found between the PD and furosemide groups in the incidence of negative fluid balance on the first postoperative day. The furosemide group was 3 times more likely to have 10% fluid overload (odds ratio [OR], 3.0; 95% CI, 1.3-6.9), was more likely to have prolonged ventilator use (OR, 3.1; 95%...
Consider the sample: 9, 6, 7, 9, 10, 8 a) Find : the mean, the median,...
Consider the sample: 9, 6, 7, 9, 10, 8 a) Find : the mean, the median, the mode b) Find : the range, the quartiles Q1, Q3, the variance, the standard deviation. c) Draw a box-plot for the given data set.
(2) Consider the sample: 9, 6. 7, 9, 10, 8 a) Find: the mean, the median,...
 (2) Consider the sample: 9, 6. 7, 9, 10, 8 a) Find: the mean, the median, the mode b) Find: the range, the quartiles Q1, Q3, the variance, the standard deviation c) Draw a box-plot for the given data set.
Tutorial Exercise Consider the following ordered data. 1 4 4 5 6 6 7 8 9...
 Tutorial Exercise Consider the following ordered data. 1 4 4 5 6 6 7 8 9 (a) Find the low, Q1, median, Q3, and high. (b) Find the interquartile range. (c) Make a box-and-whisker plot.
Question No. 1: [6 Marks) There are 24 girls and 25 boys in a Basic Business...
 Question No. 1: [6 Marks) There are 24 girls and 25 boys in a Basic Business Statistics class. On a Task-1, 15 girls and 14 boys made A-grade. A student is selected randomly. What is the probability of selecting a girl and A-grade student? Question No. 2: [6 Marks) A die is rolled twice. What is the probability of getting 2 or 5? Question No. 3: [3 Marks) How many possible permutations can be formed from the word “SUMMER”? Question...
0 Q1 D lf S- {0, 1, 2, 3, 4, 5, 6, 7, 8, 9} and...
 0 Q1 D lf S- {0, 1, 2, 3, 4, 5, 6, 7, 8, 9} and A-|0, 2, 4, 6, 8], B (1, 3, 5, 7,9), С (2, 3, 4, 5), and [1,6,7], list the elements of the sets corresponding to the following events: (a) A U C; (b) A n B; (d) (C' n D) U B; (e) (s n c)' (f) Anc n D'.
Year Annual Return Year Annual Return 9% 8% 12 14 10 4 4 12 Mean The mean, also known as the arithmetic mean, tells the The mean adds up all the observations and divides by the number of observations...
 Year Annual Return Year Annual Return 9% 8% 12 14 10 4 4 12 Mean The mean, also known as the arithmetic mean, tells the The mean adds up all the observations and divides by the number of observations, as shown in the following formula value a variable is expected to take rt The mean (or average) return for this stock over the past 12 years is mean, while μ represents a or notational purposes, x-bar represents a However, they...
Two hundred and eighty boys completed a test that measures the distance that the subject can...
 Two hundred and eighty boys completed a test that measures the distance that the subject can walk on a flat, hard surface in 6 minutes. For each age group shown in the table, the median distance walked by the boys in that age group is also given. Age Group Representative Age (Midpoint of Age Group) Median Six-Minute Walk Distance (meters) 3-5 4 544.3 6-8 7 584.0 9-11 10 667.3 12-15 13.5 701.1 16-18 17 727.6 This experiment also reported the...
I just need help on questions 7 and 8 The U.S. Department of Energy's Fuel Economy...
 I just need help on questions 7 and 8
The U.S. Department of Energy's Fuel Economy Guide provides fuel efficiency data for cars and trucks. (See exercise 35 on page 77 in your textbook for a similar problem.) Use the data in the FuelData sheet in this workbook to generate excel output to answer the following questions. Please note that units are "liters" for engine size and "miles per gallon" for highway fuel efficiency. Put the output in given space...
I just need help on questions 7 and 8
The U.S. Department of Energy's Fuel Economy Guide provides fuel efficiency data for cars and trucks. (See exercise 35 on page 77 in your textbook for a similar problem.) Use the data in the FuelData sheet in this workbook to generate excel output to answer the following questions. Please note that units are "liters" for engine size and "miles per gallon" for highway fuel efficiency. Put the output in given space...
Choose one answer for the purple blanks, answer number for orange blanks Thanks! Place Engine Size...
 Choose one answer for the purple blanks, answer number for
orange blanks
Thanks!
Place Engine Size output (starting with label) in E2 -> EngncSIzC Place Hwy Fuel Eff output (starting with labe) in H2-> Hwy Fuci Effcicncy .155 0.0855 3.1558 .0857 0.7151 Mean -> Mean Standard Error Median Mode Standard Deviation Sample Variance Kurtosis Mcan -> Mean Standard Error Median Mode Standard Deviation Sample Variance Kurtosis Skewness Range Minimum Vlaximium Sum 34.2714 .0863 34.5000 7.0000 9.0888 0.6958 0.0122 1.3757 0.1782...
Choose one answer for the purple blanks, answer number for
orange blanks
Thanks!
Place Engine Size output (starting with label) in E2 -> EngncSIzC Place Hwy Fuel Eff output (starting with labe) in H2-> Hwy Fuci Effcicncy .155 0.0855 3.1558 .0857 0.7151 Mean -> Mean Standard Error Median Mode Standard Deviation Sample Variance Kurtosis Mcan -> Mean Standard Error Median Mode Standard Deviation Sample Variance Kurtosis Skewness Range Minimum Vlaximium Sum 34.2714 .0863 34.5000 7.0000 9.0888 0.6958 0.0122 1.3757 0.1782...
 (2) Consider the sample: 9, 6. 7, 9, 10, 8 a) Find: the mean, the median, the mode b) Find: the range, the quartiles Q1, Q3, the variance, the standard deviation c) Draw a box-plot for the given data set.
 Tutorial Exercise Consider the following ordered data. 1 4 4 5 6 6 7 8 9 (a) Find the low, Q1, median, Q3, and high. (b) Find the interquartile range. (c) Make a box-and-whisker plot.
 Question No. 1: [6 Marks) There are 24 girls and 25 boys in a Basic Business Statistics class. On a Task-1, 15 girls and 14 boys made A-grade. A student is selected randomly. What is the probability of selecting a girl and A-grade student? Question No. 2: [6 Marks) A die is rolled twice. What is the probability of getting 2 or 5? Question No. 3: [3 Marks) How many possible permutations can be formed from the word “SUMMER”? Question...
 0 Q1 D lf S- {0, 1, 2, 3, 4, 5, 6, 7, 8, 9} and A-|0, 2, 4, 6, 8], B (1, 3, 5, 7,9), С (2, 3, 4, 5), and [1,6,7], list the elements of the sets corresponding to the following events: (a) A U C; (b) A n B; (d) (C' n D) U B; (e) (s n c)' (f) Anc n D'.
 Year Annual Return Year Annual Return 9% 8% 12 14 10 4 4 12 Mean The mean, also known as the arithmetic mean, tells the The mean adds up all the observations and divides by the number of observations, as shown in the following formula value a variable is expected to take rt The mean (or average) return for this stock over the past 12 years is mean, while μ represents a or notational purposes, x-bar represents a However, they...
 Two hundred and eighty boys completed a test that measures the distance that the subject can walk on a flat, hard surface in 6 minutes. For each age group shown in the table, the median distance walked by the boys in that age group is also given. Age Group Representative Age (Midpoint of Age Group) Median Six-Minute Walk Distance (meters) 3-5 4 544.3 6-8 7 584.0 9-11 10 667.3 12-15 13.5 701.1 16-18 17 727.6 This experiment also reported the...
 I just need help on questions 7 and 8
The U.S. Department of Energy's Fuel Economy Guide provides fuel efficiency data for cars and trucks. (See exercise 35 on page 77 in your textbook for a similar problem.) Use the data in the FuelData sheet in this workbook to generate excel output to answer the following questions. Please note that units are "liters" for engine size and "miles per gallon" for highway fuel efficiency. Put the output in given space...
I just need help on questions 7 and 8
The U.S. Department of Energy's Fuel Economy Guide provides fuel efficiency data for cars and trucks. (See exercise 35 on page 77 in your textbook for a similar problem.) Use the data in the FuelData sheet in this workbook to generate excel output to answer the following questions. Please note that units are "liters" for engine size and "miles per gallon" for highway fuel efficiency. Put the output in given space...
 Choose one answer for the purple blanks, answer number for
orange blanks
Thanks!
Place Engine Size output (starting with label) in E2 -> EngncSIzC Place Hwy Fuel Eff output (starting with labe) in H2-> Hwy Fuci Effcicncy .155 0.0855 3.1558 .0857 0.7151 Mean -> Mean Standard Error Median Mode Standard Deviation Sample Variance Kurtosis Mcan -> Mean Standard Error Median Mode Standard Deviation Sample Variance Kurtosis Skewness Range Minimum Vlaximium Sum 34.2714 .0863 34.5000 7.0000 9.0888 0.6958 0.0122 1.3757 0.1782...
Choose one answer for the purple blanks, answer number for
orange blanks
Thanks!
Place Engine Size output (starting with label) in E2 -> EngncSIzC Place Hwy Fuel Eff output (starting with labe) in H2-> Hwy Fuci Effcicncy .155 0.0855 3.1558 .0857 0.7151 Mean -> Mean Standard Error Median Mode Standard Deviation Sample Variance Kurtosis Mcan -> Mean Standard Error Median Mode Standard Deviation Sample Variance Kurtosis Skewness Range Minimum Vlaximium Sum 34.2714 .0863 34.5000 7.0000 9.0888 0.6958 0.0122 1.3757 0.1782...
Most questions answered within 3 hours.
-
Where is the error in this code sequence?
String s1 = "Hello";
String s2 = "ello";...
asked 10 months ago -
Financial data for Joel de Paris, Inc., for last year
follow:
Joel de Paris, Inc.
Balance...
asked 10 months ago -
Consider this reaction:
Al2(SO4)3 (aq)+ BaCl3
(aq) Al2Cl6 (aq)- +
3BaSO4(s) . What is the...
asked 10 months ago -
Suppose that Savneet is considering increasing her
recent random sample from 20 car rentals to 40...
asked 10 months ago -
Trucks arrive at an unloading terminal at an average rate of 120
per hour.
Trucks arrive...
asked 10 months ago -
Why are methanol and ethanol completely soluble in water while
octanol is not very little soluble....
asked 10 months ago -
A facilities manager at a university reads in a research report
that the mean amount of...
asked 10 months ago -
When the CuSO4 is rehydrated by adding water to the anhydrous
compound, is this an endothermic...
asked 10 months ago -
A ray of sunlight is passing from diamond into crown glass; the
angle of incidence is...
asked 10 months ago -
A block of mass 0.249 kg is placed on top of a light, vertical
spring of...
asked 10 months ago -
how do the kidneys compensate in the presences of acidosis
a) trigger hyperventilate
b) reserve acid...
asked 10 months ago -
Question 501 pts
The rental rate of capital to the firm increases. Which of the
following...
asked 10 months ago