
Homework Answers


Add Answer to:
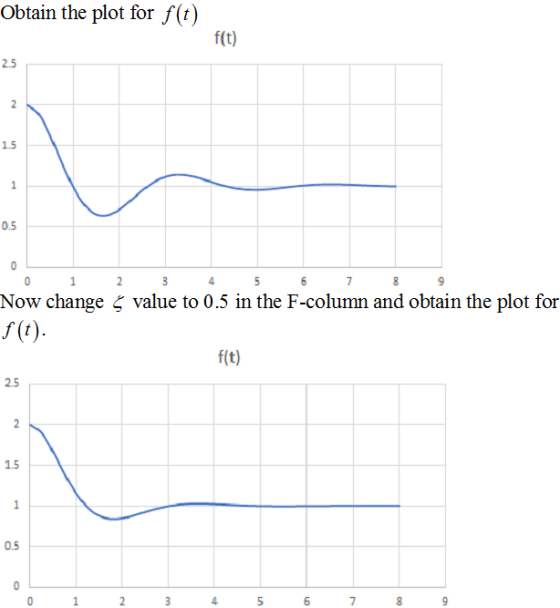
For transform #22 shown below, given S-03, A-1, and on-2, use Excel to graph ft) from...
1)Fill in the table given below, then drax a graph In (Na2S2O3] versus time(in seconds) by...
 1)Fill in the table given below, then drax a graph In (Na2S2O3] versus time(in seconds) by using excel. (20p) In Na 8,03] t(seconds) -1.02 0 - 1.20 900 -1.39 1800 -1.66 2880 -2.04 4500 In (Na2S0203) vs. Time(s) 0 1000 2000 3000 4000 5000 -0.5 -1 In (Na2S0203) -1.5 -2 -2.5 Time (s) 2) Fill in the table given below,then draw a graph of excel. (20p) versus time (in seconds) by using [Na2S2031 t(seconds) Na,,03] 2.78 3.33 4 5.26 7.69...
Follow the directions below to create an Excel graph for a perfectly competitive company. A company...
 Follow the directions below to create an Excel graph for a perfectly competitive company. A company has total costs of 200+ 2000 - 2.5Q++ 1/3Q'. The price per unit is $500. Use excel to create a table to solve the problem as in question 5. Add two columns for average total costs and average variable costs. Create a graph for quantities from 1 to 25 that has ATC, AVC, MC, and MR on it. . Give the graph a title...
The graph of f(t) is given below. 3 2 y 1 0 2 4 6 8...
 The graph of f(t) is given below. 3 2 y 1 0 2 4 6 8 10 1 Find the Laplace transform F(s) = L{f(t)} by first expressing f(t) in terms of the Heaviside function. + -38 - 2745) + { (-32–35 –e-4-2-95) Correct Answer: C4 (8-38-2-45) – e-95) Your Mark: 0/2 Attempt #1 Attempt #2 Attempt #3 Attempt #4 Attempt #5 roblem #12 Your Answer: Žice+38–245) + { (+38738_e=4 e-95) Your Mark: 0/2x
0, The height of an object, H, In fee is given in the graph after t...
 0, The height of an object, H, In fee is given in the graph after t second have passed. In the graph the dependent variable is the height of the object in feet, and the independent variable is the number of seconds after it has been launched in the air. H(0) sentence that gives the real world meaning of the calculation) solve or evaluate and then write a complete H(t)-0 (solve or evaluate and then write a complete sentence that...
Problem #9: The graph of f(t) is given below. 5 4 3 2 2 10 4 -1 1 (a) f() can be represented using the following combin...
 Problem #9: The graph of f(t) is given below. 5 4 3 2 2 10 4 -1 1 (a) f() can be represented using the following combination of Heaviside step functions а U(t - 3) + b U(t - 4) + с U(t - 9) Enter the constants a, b, and c (in that order) into the answer box below. (b) Find the Laplace transform F(s) = Pf()} for s 0. a, b, c (in that order), separated with commas....
Question 8: 1. Redraw the circuit shown below with the s domain equivalent models, where V1(t)...
 Question 8: 1. Redraw the circuit shown below with the s domain equivalent models, where V1(t) is a step function from 0 to 1V at t-0 2. Find transfer function in the s domain H( 3. Write the s-domain equation for Vout(s) if V1(s) is a 1V step function. 4. Write the equation of r of the circuit in terms of R's and C 5. Write the equation for the step response in the time domain. 6. You can either...
1. (2 pts each) The graph of some unknown function f is given below. 10 6/ 8-64-2 624 10 12 Use the graph to estimate the following quantities: (0 f (9) (g) f(4) b) lim (a) lim (e) (d) lim ( 6)...
 1. (2 pts each) The graph of some unknown function f is given below. 10 6/ 8-64-2 624 10 12 Use the graph to estimate the following quantities: (0 f (9) (g) f(4) b) lim (a) lim (e) (d) lim ( 6) (e) lim f(x) (c) lim f(x) if g(x)f(x) 6) a value of r where f is continuous but not differentiable (k) a value of r where f"(x) 0 and f"(x)>0 (1) the location of a relative maximum value...
1. Use combinations of STEP FUNCTIONS to describe each continuous-time signal shown below. f(t) 0 2...
 1. Use combinations of STEP FUNCTIONS to describe each continuous-time signal shown below. f(t) 0 2 4 6 0 1 2 3 0 1 2 3 4 2. Sketch the following signals: (a) x (t)=1 [u(t+2)-u(t-1)] (c) X(t)=\fety (b) X(t)=t.e (d) x (t) = u(t) u(t-1).ult-2).u(t-3) 3. Determine whether the systems below are linear and time invariant. Justify your answer! (a) y(t) = x(31) (b) y(t)= 2x(1-t) y(t)=cos(x(t)] 4. Simplify the expressions: (a) y(t)=1.8(t+2)+(t +1) 8(1-1)+(t+3). 8(t) (b) y(t) =...
I need someone to help answer table 1 only mass, volume, y density and table 2...
 I need someone to help answer table 1 only mass,
volume, y density and table 2 with a graph each table.
please read the procesures, thank you
Experiment 2 Graphing and Measurements Graphs summarize numerical data efficiently and are usually casier to understand and interpret than columns of numbers. In this experiment, you will collect data and construct a graph that makes an effective visual presentation. Materials: Equipment metric ruler Chemical a kit with 5 pieces Procedure: Part I: Measurements...
I need someone to help answer table 1 only mass,
volume, y density and table 2 with a graph each table.
please read the procesures, thank you
Experiment 2 Graphing and Measurements Graphs summarize numerical data efficiently and are usually casier to understand and interpret than columns of numbers. In this experiment, you will collect data and construct a graph that makes an effective visual presentation. Materials: Equipment metric ruler Chemical a kit with 5 pieces Procedure: Part I: Measurements...
(1 point) A stone is thrown from a rooftop at time t 0 seconds. Its position at time t (the components are measured in meters) is given by r()-бі-50+ (24.5-49:2) k. The origin is at the base of...
 (1 point) A stone is thrown from a rooftop at time t 0 seconds. Its position at time t (the components are measured in meters) is given by r()-бі-50+ (24.5-49:2) k. The origin is at the base of the bulding, which is standing on flat ground. Distance is measured in meters. The vector i points east,j points north, and k points up. (a) How high is the rooftop? meters. (b) When does the stone hit the ground? seconds (c) Where...
 1)Fill in the table given below, then drax a graph In (Na2S2O3] versus time(in seconds) by using excel. (20p) In Na 8,03] t(seconds) -1.02 0 - 1.20 900 -1.39 1800 -1.66 2880 -2.04 4500 In (Na2S0203) vs. Time(s) 0 1000 2000 3000 4000 5000 -0.5 -1 In (Na2S0203) -1.5 -2 -2.5 Time (s) 2) Fill in the table given below,then draw a graph of excel. (20p) versus time (in seconds) by using [Na2S2031 t(seconds) Na,,03] 2.78 3.33 4 5.26 7.69...
 Follow the directions below to create an Excel graph for a perfectly competitive company. A company has total costs of 200+ 2000 - 2.5Q++ 1/3Q'. The price per unit is $500. Use excel to create a table to solve the problem as in question 5. Add two columns for average total costs and average variable costs. Create a graph for quantities from 1 to 25 that has ATC, AVC, MC, and MR on it. . Give the graph a title...
 The graph of f(t) is given below. 3 2 y 1 0 2 4 6 8 10 1 Find the Laplace transform F(s) = L{f(t)} by first expressing f(t) in terms of the Heaviside function. + -38 - 2745) + { (-32–35 –e-4-2-95) Correct Answer: C4 (8-38-2-45) – e-95) Your Mark: 0/2 Attempt #1 Attempt #2 Attempt #3 Attempt #4 Attempt #5 roblem #12 Your Answer: Žice+38–245) + { (+38738_e=4 e-95) Your Mark: 0/2x
 0, The height of an object, H, In fee is given in the graph after t second have passed. In the graph the dependent variable is the height of the object in feet, and the independent variable is the number of seconds after it has been launched in the air. H(0) sentence that gives the real world meaning of the calculation) solve or evaluate and then write a complete H(t)-0 (solve or evaluate and then write a complete sentence that...
 Problem #9: The graph of f(t) is given below. 5 4 3 2 2 10 4 -1 1 (a) f() can be represented using the following combination of Heaviside step functions а U(t - 3) + b U(t - 4) + с U(t - 9) Enter the constants a, b, and c (in that order) into the answer box below. (b) Find the Laplace transform F(s) = Pf()} for s 0. a, b, c (in that order), separated with commas....
 Question 8: 1. Redraw the circuit shown below with the s domain equivalent models, where V1(t) is a step function from 0 to 1V at t-0 2. Find transfer function in the s domain H( 3. Write the s-domain equation for Vout(s) if V1(s) is a 1V step function. 4. Write the equation of r of the circuit in terms of R's and C 5. Write the equation for the step response in the time domain. 6. You can either...
 1. (2 pts each) The graph of some unknown function f is given below. 10 6/ 8-64-2 624 10 12 Use the graph to estimate the following quantities: (0 f (9) (g) f(4) b) lim (a) lim (e) (d) lim ( 6) (e) lim f(x) (c) lim f(x) if g(x)f(x) 6) a value of r where f is continuous but not differentiable (k) a value of r where f"(x) 0 and f"(x)>0 (1) the location of a relative maximum value...
 1. Use combinations of STEP FUNCTIONS to describe each continuous-time signal shown below. f(t) 0 2 4 6 0 1 2 3 0 1 2 3 4 2. Sketch the following signals: (a) x (t)=1 [u(t+2)-u(t-1)] (c) X(t)=\fety (b) X(t)=t.e (d) x (t) = u(t) u(t-1).ult-2).u(t-3) 3. Determine whether the systems below are linear and time invariant. Justify your answer! (a) y(t) = x(31) (b) y(t)= 2x(1-t) y(t)=cos(x(t)] 4. Simplify the expressions: (a) y(t)=1.8(t+2)+(t +1) 8(1-1)+(t+3). 8(t) (b) y(t) =...
 I need someone to help answer table 1 only mass,
volume, y density and table 2 with a graph each table.
please read the procesures, thank you
Experiment 2 Graphing and Measurements Graphs summarize numerical data efficiently and are usually casier to understand and interpret than columns of numbers. In this experiment, you will collect data and construct a graph that makes an effective visual presentation. Materials: Equipment metric ruler Chemical a kit with 5 pieces Procedure: Part I: Measurements...
I need someone to help answer table 1 only mass,
volume, y density and table 2 with a graph each table.
please read the procesures, thank you
Experiment 2 Graphing and Measurements Graphs summarize numerical data efficiently and are usually casier to understand and interpret than columns of numbers. In this experiment, you will collect data and construct a graph that makes an effective visual presentation. Materials: Equipment metric ruler Chemical a kit with 5 pieces Procedure: Part I: Measurements...
 (1 point) A stone is thrown from a rooftop at time t 0 seconds. Its position at time t (the components are measured in meters) is given by r()-бі-50+ (24.5-49:2) k. The origin is at the base of the bulding, which is standing on flat ground. Distance is measured in meters. The vector i points east,j points north, and k points up. (a) How high is the rooftop? meters. (b) When does the stone hit the ground? seconds (c) Where...
Most questions answered within 3 hours.
-
Where is the error in this code sequence?
String s1 = "Hello";
String s2 = "ello";...
asked 10 months ago -
Financial data for Joel de Paris, Inc., for last year
follow:
Joel de Paris, Inc.
Balance...
asked 10 months ago -
Consider this reaction:
Al2(SO4)3 (aq)+ BaCl3
(aq) Al2Cl6 (aq)- +
3BaSO4(s) . What is the...
asked 10 months ago -
Suppose that Savneet is considering increasing her
recent random sample from 20 car rentals to 40...
asked 10 months ago -
Trucks arrive at an unloading terminal at an average rate of 120
per hour.
Trucks arrive...
asked 10 months ago -
Why are methanol and ethanol completely soluble in water while
octanol is not very little soluble....
asked 10 months ago -
A facilities manager at a university reads in a research report
that the mean amount of...
asked 10 months ago -
When the CuSO4 is rehydrated by adding water to the anhydrous
compound, is this an endothermic...
asked 10 months ago -
A ray of sunlight is passing from diamond into crown glass; the
angle of incidence is...
asked 10 months ago -
A block of mass 0.249 kg is placed on top of a light, vertical
spring of...
asked 10 months ago -
how do the kidneys compensate in the presences of acidosis
a) trigger hyperventilate
b) reserve acid...
asked 10 months ago -
Question 501 pts
The rental rate of capital to the firm increases. Which of the
following...
asked 10 months ago