Imagine a population that is in H-W equilibrium and p=.3 . Draw a graph that shows...
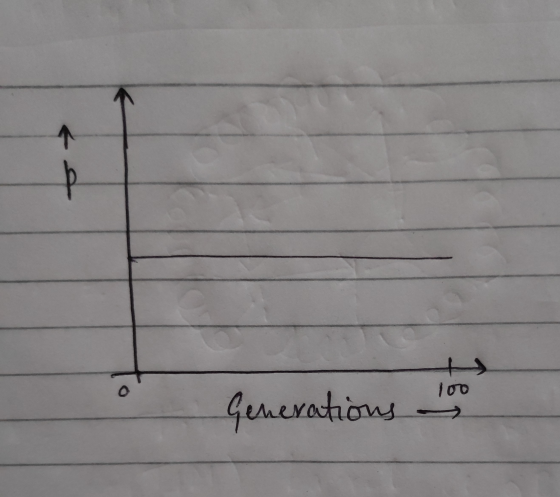
Imagine a population that is in H-W equilibrium and p=.3 . Draw a graph that shows what p would be over 100 generations. (Y-axis = p, X-axis= generations)
Homework Answers
According Hardy-Weinberg equilibrium:
- allele frequencies in a population will not change from generation to generation.
- if the frequency of two alleles in a population at a locus are p and q, then the expected genotype frequencies will be p2, 2pq, and q2. Once a population is in Hardy-Weinberg equilibrium this frequency distribution will not change from generation to generation.
Therefore, in H-W equilibrium p will be constant over generations.
Add Answer to:
Imagine a population that is in H-W equilibrium and p=.3 . Draw
a graph that shows...
Imagine a population where the allele for p provides a slight advantage. Draw a graph that...
Imagine a population where the allele for p provides a slight advantage. Draw a graph that shows how p would change over 100 generations.
1) Draw a graph of Reaction Progress ( R P) on the x- axis versus Gibbs...
 1) Draw a graph of Reaction Progress ( R P) on the x- axis versus Gibbs Free Energy (G) on the y-axis with AG=+30 kJ. Label values on the y-axis. 2) Indicate (with an "X") a spot on your graph that represents a spontaneous reaction. What is the sign of AG at this point? • 3) What is the relative value of K (equilibrium constant) for this reaction?
3. The graph below has axes to show the population sizes of a predator and its...
 3. The graph below has axes to show the population sizes of a predator and its prey. The dashed lines are the predator and prey isoclines. Prey Population Starting at the circle, draw in what will happen to the two populations if they are following the pattern in the Lotka-Volterra model of predation. (Remember that BOTH predator and prey numbers are represented by a point on the graph.) Use a series of arrows to show what happens. 2. Imagine two...
B. The components of the Hardy-Weinberg equation and population equilibrium What is the H-W equation and...
B. The components of the Hardy-Weinberg equation and population equilibrium What is the H-W equation and what does it represent? What are the Components of the equation? How does H-W equilibrium (HWE) relate to evolutionary prediction? What are the evolutionary components that can’t be occurring for a population to remain in HWE
Problem 2. The picture shows a graph of the electric potential in a region of space...
 Problem 2. The picture shows a graph of the electric potential in a region of space where the electric field is parallel to the x-axis. AV(x), Volts 200 a) Draw a graph of Ex versus x. 100 b) Label the maximum and minimum electric field on the y-axis of your graph (including units). .x, m 2 c) If an electron is placed at x = 4 m, what it would do? 3 4 5 6 7 8 -100H A. Stay...
1. When the equilibrium price is 30 and equilibrium quantity is 2000. Intercept of Supply curve in the p axis is 10 and intercept of Demand curve in the p axis is 60. a) Draw the graph of equilibrium...
1. When the equilibrium price is 30 and equilibrium quantity is 2000. Intercept of Supply curve in the p axis is 10 and intercept of Demand curve in the p axis is 60. a) Draw the graph of equilibrium and label the equilibrium price, equilibrium quantity, consumer surplus, producer surplus and total surplus in the graph. b) Calculate consumer surplus, producer surplus and total surplus. c) Explain which buyers consume the good and which producers sell the good inthe equilibrium...
The graph shows the foreign exchange market. Draw a point at the equilibrium exchange rate and...
 The graph shows the foreign exchange market. Draw a point at the equilibrium exchange rate and the equilibrium quantity of dollars. Draw a horizontal line at a price at which there is a surplus of dollars. Label it Surplus. Draw an arrow that shows the change in the quantity demanded as the foreign exchange market moves from the price at which you have indicated the surplus toward equilibrium. Label it 1. Exchange rate (yen per U.S. dollar) 1.4 1.5 1.6
2. The demand for money is: Mº = PYL (1), where P is the price level,...
 2. The demand for money is: Mº = PYL (1), where P is the price level, Y is the real GDP and L () is an inverse function of the rate of interest (i.e. when i increases, L (1) decreases, and vice versa). Money supply is: M$ = mH, where H is the high-powered money issued by the central bank and m is the money multiplier. (a) Draw the money demand and supply curves on a graph with money demand...
C) Let y - Ara. Suppose that we see when p - 2 and w - 1 then x-3 and y-8. Also when p-1 and w 1....
 We were unable to transcribe this imageWe were unable to transcribe this imagec) Let y - Ara. Suppose that we see when p - 2 and w - 1 then x-3 and y-8. Also when p-1 and w 1.5, then x-4 and y - 10. Can we identify the parameters of the production function from these two observations? Graph what an economist who didn't know the functional form of the production function would conclude about the production set.
c) Let...
We were unable to transcribe this imageWe were unable to transcribe this imagec) Let y - Ara. Suppose that we see when p - 2 and w - 1 then x-3 and y-8. Also when p-1 and w 1.5, then x-4 and y - 10. Can we identify the parameters of the production function from these two observations? Graph what an economist who didn't know the functional form of the production function would conclude about the production set.
c) Let...
Question 3: (45 marks] Suppose the price-setting equation is given by P= (1 + m)W where...
 Question 3: (45 marks] Suppose the price-setting equation is given by P= (1 + m)W where m is the markup. The wage-setting equation is given by W = pe? where z are unemployment benefts and u is the unemployment rate. 1. Derive the real wage and unemployment consistent with equilibrium in the labor market in the medium run. Is this the natural rate of unemployment? Does the equilibrium rate of unemployment change if unemployment benefts decrease? Explain? (8 marks] 2....
 1) Draw a graph of Reaction Progress ( R P) on the x- axis versus Gibbs Free Energy (G) on the y-axis with AG=+30 kJ. Label values on the y-axis. 2) Indicate (with an "X") a spot on your graph that represents a spontaneous reaction. What is the sign of AG at this point? • 3) What is the relative value of K (equilibrium constant) for this reaction?
 3. The graph below has axes to show the population sizes of a predator and its prey. The dashed lines are the predator and prey isoclines. Prey Population Starting at the circle, draw in what will happen to the two populations if they are following the pattern in the Lotka-Volterra model of predation. (Remember that BOTH predator and prey numbers are represented by a point on the graph.) Use a series of arrows to show what happens. 2. Imagine two...
 Problem 2. The picture shows a graph of the electric potential in a region of space where the electric field is parallel to the x-axis. AV(x), Volts 200 a) Draw a graph of Ex versus x. 100 b) Label the maximum and minimum electric field on the y-axis of your graph (including units). .x, m 2 c) If an electron is placed at x = 4 m, what it would do? 3 4 5 6 7 8 -100H A. Stay...
 The graph shows the foreign exchange market. Draw a point at the equilibrium exchange rate and the equilibrium quantity of dollars. Draw a horizontal line at a price at which there is a surplus of dollars. Label it Surplus. Draw an arrow that shows the change in the quantity demanded as the foreign exchange market moves from the price at which you have indicated the surplus toward equilibrium. Label it 1. Exchange rate (yen per U.S. dollar) 1.4 1.5 1.6
 2. The demand for money is: Mº = PYL (1), where P is the price level, Y is the real GDP and L () is an inverse function of the rate of interest (i.e. when i increases, L (1) decreases, and vice versa). Money supply is: M$ = mH, where H is the high-powered money issued by the central bank and m is the money multiplier. (a) Draw the money demand and supply curves on a graph with money demand...
 We were unable to transcribe this imageWe were unable to transcribe this imagec) Let y - Ara. Suppose that we see when p - 2 and w - 1 then x-3 and y-8. Also when p-1 and w 1.5, then x-4 and y - 10. Can we identify the parameters of the production function from these two observations? Graph what an economist who didn't know the functional form of the production function would conclude about the production set.
c) Let...
We were unable to transcribe this imageWe were unable to transcribe this imagec) Let y - Ara. Suppose that we see when p - 2 and w - 1 then x-3 and y-8. Also when p-1 and w 1.5, then x-4 and y - 10. Can we identify the parameters of the production function from these two observations? Graph what an economist who didn't know the functional form of the production function would conclude about the production set.
c) Let...
 Question 3: (45 marks] Suppose the price-setting equation is given by P= (1 + m)W where m is the markup. The wage-setting equation is given by W = pe? where z are unemployment benefts and u is the unemployment rate. 1. Derive the real wage and unemployment consistent with equilibrium in the labor market in the medium run. Is this the natural rate of unemployment? Does the equilibrium rate of unemployment change if unemployment benefts decrease? Explain? (8 marks] 2....
Most questions answered within 3 hours.
-
Where is the error in this code sequence?
String s1 = "Hello";
String s2 = "ello";...
asked 10 months ago -
Financial data for Joel de Paris, Inc., for last year
follow:
Joel de Paris, Inc.
Balance...
asked 10 months ago -
Consider this reaction:
Al2(SO4)3 (aq)+ BaCl3
(aq) Al2Cl6 (aq)- +
3BaSO4(s) . What is the...
asked 10 months ago -
Suppose that Savneet is considering increasing her
recent random sample from 20 car rentals to 40...
asked 10 months ago -
Trucks arrive at an unloading terminal at an average rate of 120
per hour.
Trucks arrive...
asked 10 months ago -
Why are methanol and ethanol completely soluble in water while
octanol is not very little soluble....
asked 10 months ago -
A facilities manager at a university reads in a research report
that the mean amount of...
asked 10 months ago -
When the CuSO4 is rehydrated by adding water to the anhydrous
compound, is this an endothermic...
asked 10 months ago -
A ray of sunlight is passing from diamond into crown glass; the
angle of incidence is...
asked 10 months ago -
A block of mass 0.249 kg is placed on top of a light, vertical
spring of...
asked 10 months ago -
how do the kidneys compensate in the presences of acidosis
a) trigger hyperventilate
b) reserve acid...
asked 10 months ago -
Question 501 pts
The rental rate of capital to the firm increases. Which of the
following...
asked 10 months ago