
Homework Answers
Add Answer to:
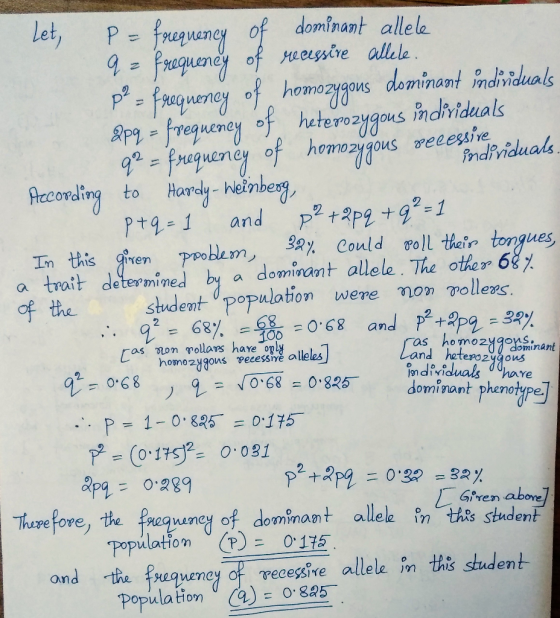
have the disease lods ISUUT. In a group of Learning Store students, 32% could roll their...
The Hardy-Weinberg principle and its equations predict that frequencies of alleles and genotypes remain constant from generation to generation in populations that are not evolving
.1. The Hardy-Weinberg principle and its equations predict that frequencies of alleles and genotypes remain constant from generation to generation in populations that are not evolving. What five conditions does this prediction assume to be true about such a population? a._______ b._______ c._______ d._______ e._______ 2. Before beginning the activity, answer the following general Hardy-Weinberg problems for practice (assume that the population is at Hardy-Weinberg equilibrium).a. If the frequency of a recessive allele is 0.3, what is the frequency of the dominant...
2.3 Problem 3 The Hardy-Weinberg equation is useful for predicting the percent of a hu- man...
 2.3 Problem 3 The Hardy-Weinberg equation is useful for predicting the percent of a hu- man population that may be heterozygous carriers of recessive alleles for certain genetic diseases. Phenylketonuria (PKU) is a human metabolic dis- order that results in mental retardation if it is untreated in infancy. In the United States, one out of approximately 10.000 babies is born with the disor- der. Approximately what percent of the population are heterozygous carriers of the recessive PKU allele? If you...
Let's use this equation to solve the following problem: In pea plants, the allele for tall...
 Let's use this equation to solve the following problem: In pea plants, the allele for tall plants (T) is dominant to the allele for dwarf plants (1). If a population of 100 plants has 36 dwarf plants, what is the frequency of each allele? Here is a step-by-step guide: 1. Let p = frequency of the dominant allele (R), and q = frequency of the recessive allele (1). 2.92 = frequency of the homozygous recessive = 36%, or 0.36. Since...
D. The frequencies of the genotypes "AA" and "Aa." E. The frequencies of the two possible...
 D. The frequencies of the genotypes "AA" and "Aa." E. The frequencies of the two possible phenotypes if "A" is completely dominant over "a." 3. There are 100 students in a class. Ninety-six did well in the course whereas four blew it totally and received a grade of F. Sorry. In the highly unlikely event that these traits are genetic rather than environmental, if these traits involve dominant and recessive alleles, and if the four (4%) represent the frequency of...
07.900 Thi 3. Le 1. You have sampled a population in which you know that the...
 07.900 Thi 3. Le 1. You have sampled a population in which you know that the percentage of the homove recessive genotype(a) is 36%. Using that 36%, calculate the following: A. The frequency of the "sa" genotype. B. The frequency of the altele. 80 C. The frequency of the "A"allele. D. The frequencies of the genotypes "A" and "Aa." 3-12ft ocity of the The frequencies of the two possible phenotypes if 'Ais completely dominant over "a. opactisol the derivatives in...
You have a cup of beans in front of you with 20 white beans and 24...
You have a cup of beans in front of you with 20 white beans and 24 red beans. These beans represent the alleles for a simple Mendelian trait, where red is dominant (R) and white is recessive (r). In 1997, a self-isolated group of people living on a small island was joined by a group of explorers from a nearby island. STEP 1. Create the original, self-isolated population. The self-isolated population consists of six males. Three of them are homozygous...
I've tried 0.16, 0.48, 0.36 and 32, 96, 72 I have 2 trials left, please help....
 I've tried 0.16, 0.48, 0.36
and 32, 96, 72
I have 2 trials left, please help.
Here's a hint: Hint 2. How to calculate the
expected frequencies of a different example population Consider an
example population of individuals that have two alleles for a
specific locus, AB and AC. In the population, 70% (0.7) of the
alleles are AB, and 30% (0.3) of the alleles are AC. The expected
frequencies of each genotype can be calculated using the equation
for...
I've tried 0.16, 0.48, 0.36
and 32, 96, 72
I have 2 trials left, please help.
Here's a hint: Hint 2. How to calculate the
expected frequencies of a different example population Consider an
example population of individuals that have two alleles for a
specific locus, AB and AC. In the population, 70% (0.7) of the
alleles are AB, and 30% (0.3) of the alleles are AC. The expected
frequencies of each genotype can be calculated using the equation
for...
5. Fur colour in mice is a single gene trait controled by two alleles. In a population of 75 mice, 21 are homozyg...
 5. Fur colour in mice is a single gene trait controled by two alleles. In a population of 75 mice, 21 are homozygous dominant, 37 are heterozygous dominant, and 17 are homozygous recessive. What is the frequency of the dominant allele in the population? Show all work and record your answer as a value between O and 1 rounded to two decimal places 6. The Hardy-Weinberg principle states that allele and genotype frequencies remain constant from one generation to the...
Activity 1: What traits do you have? Trait Class Totals Freckles # freckles #no freckles (yes/no) No 교교 a Paper Taster? (es/no) No I4t It Sodium Benzoate Paper Taster? (yes/no) # taste 121 #non...
 Activity 1: What traits do you have? Trait Class Totals Freckles # freckles #no freckles (yes/no) No 교교 a Paper Taster? (es/no) No I4t It Sodium Benzoate Paper Taster? (yes/no) # taste 121 #nontaster Control Paper Taster? (ges/no) # taster #nontaster ト O 고구 #brown-50m。 Eye Color #blue-green forown Peak #widow #straight ig Hairline Widow's peak/Straight widowa Tongue Rolling ability Roller/non-roller #non-roller #Roller Non Kollen 2: Determine Phenotypic Proportions of Different Traits and e Corresponding Frequencies of the Determining Alleles...
i wouldnt mind if someone could check my work on the first page. but whats confusing...
 i wouldnt mind if someone could check my work on the first
page. but whats confusing me is section B. it starts on the bottom
of the first page and carries onto the second page.
A. Estimation of allele frequency for a specific trait Fill in the tables below for taster and allele frequencies in your class section. Taster/Non-taster Frequency=Genotype frequency (1 pt) # of students #Tasters Frequency of # Non-tasters in Lab Section Tasters (p+2pg) 16 1 = 5125...
i wouldnt mind if someone could check my work on the first
page. but whats confusing me is section B. it starts on the bottom
of the first page and carries onto the second page.
A. Estimation of allele frequency for a specific trait Fill in the tables below for taster and allele frequencies in your class section. Taster/Non-taster Frequency=Genotype frequency (1 pt) # of students #Tasters Frequency of # Non-tasters in Lab Section Tasters (p+2pg) 16 1 = 5125...
 2.3 Problem 3 The Hardy-Weinberg equation is useful for predicting the percent of a hu- man population that may be heterozygous carriers of recessive alleles for certain genetic diseases. Phenylketonuria (PKU) is a human metabolic dis- order that results in mental retardation if it is untreated in infancy. In the United States, one out of approximately 10.000 babies is born with the disor- der. Approximately what percent of the population are heterozygous carriers of the recessive PKU allele? If you...
 Let's use this equation to solve the following problem: In pea plants, the allele for tall plants (T) is dominant to the allele for dwarf plants (1). If a population of 100 plants has 36 dwarf plants, what is the frequency of each allele? Here is a step-by-step guide: 1. Let p = frequency of the dominant allele (R), and q = frequency of the recessive allele (1). 2.92 = frequency of the homozygous recessive = 36%, or 0.36. Since...
 D. The frequencies of the genotypes "AA" and "Aa." E. The frequencies of the two possible phenotypes if "A" is completely dominant over "a." 3. There are 100 students in a class. Ninety-six did well in the course whereas four blew it totally and received a grade of F. Sorry. In the highly unlikely event that these traits are genetic rather than environmental, if these traits involve dominant and recessive alleles, and if the four (4%) represent the frequency of...
 07.900 Thi 3. Le 1. You have sampled a population in which you know that the percentage of the homove recessive genotype(a) is 36%. Using that 36%, calculate the following: A. The frequency of the "sa" genotype. B. The frequency of the altele. 80 C. The frequency of the "A"allele. D. The frequencies of the genotypes "A" and "Aa." 3-12ft ocity of the The frequencies of the two possible phenotypes if 'Ais completely dominant over "a. opactisol the derivatives in...
 I've tried 0.16, 0.48, 0.36
and 32, 96, 72
I have 2 trials left, please help.
Here's a hint: Hint 2. How to calculate the
expected frequencies of a different example population Consider an
example population of individuals that have two alleles for a
specific locus, AB and AC. In the population, 70% (0.7) of the
alleles are AB, and 30% (0.3) of the alleles are AC. The expected
frequencies of each genotype can be calculated using the equation
for...
I've tried 0.16, 0.48, 0.36
and 32, 96, 72
I have 2 trials left, please help.
Here's a hint: Hint 2. How to calculate the
expected frequencies of a different example population Consider an
example population of individuals that have two alleles for a
specific locus, AB and AC. In the population, 70% (0.7) of the
alleles are AB, and 30% (0.3) of the alleles are AC. The expected
frequencies of each genotype can be calculated using the equation
for...
 5. Fur colour in mice is a single gene trait controled by two alleles. In a population of 75 mice, 21 are homozygous dominant, 37 are heterozygous dominant, and 17 are homozygous recessive. What is the frequency of the dominant allele in the population? Show all work and record your answer as a value between O and 1 rounded to two decimal places 6. The Hardy-Weinberg principle states that allele and genotype frequencies remain constant from one generation to the...
 Activity 1: What traits do you have? Trait Class Totals Freckles # freckles #no freckles (yes/no) No 교교 a Paper Taster? (es/no) No I4t It Sodium Benzoate Paper Taster? (yes/no) # taste 121 #nontaster Control Paper Taster? (ges/no) # taster #nontaster ト O 고구 #brown-50m。 Eye Color #blue-green forown Peak #widow #straight ig Hairline Widow's peak/Straight widowa Tongue Rolling ability Roller/non-roller #non-roller #Roller Non Kollen 2: Determine Phenotypic Proportions of Different Traits and e Corresponding Frequencies of the Determining Alleles...
 i wouldnt mind if someone could check my work on the first
page. but whats confusing me is section B. it starts on the bottom
of the first page and carries onto the second page.
A. Estimation of allele frequency for a specific trait Fill in the tables below for taster and allele frequencies in your class section. Taster/Non-taster Frequency=Genotype frequency (1 pt) # of students #Tasters Frequency of # Non-tasters in Lab Section Tasters (p+2pg) 16 1 = 5125...
i wouldnt mind if someone could check my work on the first
page. but whats confusing me is section B. it starts on the bottom
of the first page and carries onto the second page.
A. Estimation of allele frequency for a specific trait Fill in the tables below for taster and allele frequencies in your class section. Taster/Non-taster Frequency=Genotype frequency (1 pt) # of students #Tasters Frequency of # Non-tasters in Lab Section Tasters (p+2pg) 16 1 = 5125...
Most questions answered within 3 hours.
-
Where is the error in this code sequence?
String s1 = "Hello";
String s2 = "ello";...
asked 11 months ago -
Financial data for Joel de Paris, Inc., for last year
follow:
Joel de Paris, Inc.
Balance...
asked 11 months ago -
Consider this reaction:
Al2(SO4)3 (aq)+ BaCl3
(aq) Al2Cl6 (aq)- +
3BaSO4(s) . What is the...
asked 11 months ago -
Suppose that Savneet is considering increasing her
recent random sample from 20 car rentals to 40...
asked 11 months ago -
Trucks arrive at an unloading terminal at an average rate of 120
per hour.
Trucks arrive...
asked 11 months ago -
Why are methanol and ethanol completely soluble in water while
octanol is not very little soluble....
asked 11 months ago -
A facilities manager at a university reads in a research report
that the mean amount of...
asked 11 months ago -
When the CuSO4 is rehydrated by adding water to the anhydrous
compound, is this an endothermic...
asked 11 months ago -
A ray of sunlight is passing from diamond into crown glass; the
angle of incidence is...
asked 11 months ago -
A block of mass 0.249 kg is placed on top of a light, vertical
spring of...
asked 11 months ago -
how do the kidneys compensate in the presences of acidosis
a) trigger hyperventilate
b) reserve acid...
asked 11 months ago -
Question 501 pts
The rental rate of capital to the firm increases. Which of the
following...
asked 11 months ago