 table
4
table
4 protein
concentrations
protein
concentrationsHomework Answers
The standard curve fits the straight line equation of Y = 0.106x + 0.0433.
This equation can be used to find value to X-ordinates (protein concentrations) given Y co-ordinate by transforming in the following manner; X = (y – 0.0433)/0.106
For sample with abs 0.071, protein concentration= (0.071 -0.0433)/0.106 = 0.26
For sample with abs 2.71, protein concentration= (2.71 -0.0433)/0.106 = 25.15
For sample with abs 0.0117, protein concentration= (0.0117 -0.0433)/0.106 = -0.298; gives negative vale, means the protein concentration is very low or doesn’t have protein as compared to the standard concentrations.
These results may not be accurate as the absorbance values do not lie in the linear range of the standard curve (absorbance values range from 0.15 to 1).
|
Estimated protein concentration |
Absorbance |
|
-0.298 |
0.0117 |
|
0.26 |
0.071 |
|
25.15 |
2.71 |
The standard curve has an R2 value of 0.98 which is very close to 1. An R2 value closer to 1 indicates that there is a linear relationship between variables of x-axis and y-axis. If x-axis variable changes by a factor, we can predict the value of y-axis as they have linear relationship. This will serve as a reliable tool to predict the unknown protein concentrations when absorbance values in the range are given.
If R2 is not closer to 1 that indicates that we are not sure of a linear relation between x-axis (protein concentration) and y-axis (absorbance) variables. We cannot reliably predict the change in one variable given a respective change in other one.
Add Answer to:
please answer 1 and 2
table
4
protein
concentrations
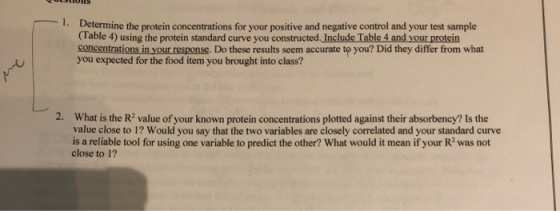
1. Determine the protein concentrations for your...
Both Biuret and Bradford methods was used to determine unknown concentrations of both BSA and BIg....
Both Biuret and Bradford methods was used to determine unknown concentrations of both BSA and BIg. The methods followed is described in detail in the Background section. The following results was obtained: Table 1: Absorbance at 595nm obtained for different concentrations of protein standards using the Bradford method [Protein] (mg/ml) 0.00 0.125 0.25 0.50 0.75 1.00 1.50 2.00 Unknown Abs. BSA 0 0.130 0.350 0.620 0.870 1.120 1.400 1.60 1.050 Abs. BIg 0 0.080 0.130 0.360 0.520 0.650 0.850 1.080...
1. You want to prepare a 1:50 dilution of your protein extract in a total volume...
1. You want to prepare a 1:50 dilution of your protein extract in a total volume of 1000 uL. You will need ___ uL of protein extract and ___ uL of water. 2. You are provided with a solution of BSA that is 100 ug/mL and make a 10-2 dilution? What is the resulting concentration of the DILUTED BSA? 3. Which of the following statements about enzymes is true? Select one: a. Enzymes increase the rate of a chemical reaction...
Table 5. Drink mix concentrations and absorbances for constructing a standard curve Concentration Concentration Absorbance (mm)...
 Table 5. Drink mix concentrations and absorbances for constructing a standard curve Concentration Concentration Absorbance (mm) (M) Sample 1 0.51 Sample 2 Sample 3 Sample 4 How do I calculate to find (M)?
5. The following data were obtained when Bio 106 students created solutions of the following concentrations...
 5. The following data were obtained when Bio 106 students created solutions of the following concentrations (column 1), These students then placed three different samples of each concentration in a spectrophotometer and measured the absorbance. The following data table was created by these students. Create a standard curve from the data in the following table. Be sure to calculate the average absorbance for each concentration (round to two decimal places). After you have created the table, answer the following questions....
Table 3: Absorbance for varying concentrations of Co(NO3)2 at max wavelength Sample Number Concentration (mM) Absorbance...
 Table 3: Absorbance for varying
concentrations of Co(NO3)2 at max
wavelength
Sample Number
Concentration (mM)
Absorbance
0
0 mM
0.00
1
30 mM
0.13
2
60 mM
0.27
3
90mM
0.40
4
120mM
0.53
5
150 mM
0.67
Answer the following questions based on your calibration curve
Calculate the
l value from the slope of your graph
Table 3: Absorbance for varying
concentrations of Co(NO3)2 at max
wavelength
Sample Number
Concentration (mM)
Absorbance
0
0 mM
0.00
1
30 mM
0.13
2
60 mM
0.27
3
90mM
0.40
4
120mM
0.53
5
150 mM
0.67
Answer the following questions based on your calibration curve
Calculate the
l value from the slope of your graph
please help answer questions for mixture 1 AND mixture 2 thank you! Table 23.1 Test Tube...
 please help answer questions for mixture 1 AND mixture 2 thank
you!
Table 23.1 Test Tube Number 1 2 3 4 5 5,00 1.00 5.00 2.00 Volume Fe(NO), solution (ml.) Volume KSCN solution (ml.) Volume H,O (ml.) 5.00 3.00 2.00 5.00 4.00 5.00 5.00 0.00 4.00 3.00 1.00 Mixture 2 3 4 5 Absorbance 0.079 0.165 0.246 0.311 0.400 In order to convert the absorbance values provided below into equilibrium concentrations of FeSCN?, you will need to know the slope...
please help answer questions for mixture 1 AND mixture 2 thank
you!
Table 23.1 Test Tube Number 1 2 3 4 5 5,00 1.00 5.00 2.00 Volume Fe(NO), solution (ml.) Volume KSCN solution (ml.) Volume H,O (ml.) 5.00 3.00 2.00 5.00 4.00 5.00 5.00 0.00 4.00 3.00 1.00 Mixture 2 3 4 5 Absorbance 0.079 0.165 0.246 0.311 0.400 In order to convert the absorbance values provided below into equilibrium concentrations of FeSCN?, you will need to know the slope...
PROCEDURE Table 4.1: Dilutions of Albumin for Standard Curve Determination. SAMPLE NUMBER VOLUME OF 0.9% NACL...
 PROCEDURE Table 4.1: Dilutions of Albumin for Standard Curve Determination. SAMPLE NUMBER VOLUME OF 0.9% NACL (mL) VOLUME OF 10 mg/ml ALBUMIN STOCK SOLUTION (mL) VOLUME OF BIURET REAGENT (mL) TOTAL VOLUME IN EACH TUBE ABSORBANCE READING ALBUMIN CONCENTRATION IN SOLUTION 1 (Blank) 1.0 mL OmL 4.0 mL 0.8 mL 0.2 mL 4.0 mL .4 0.6 mL 0.4 mL 4.0 mL 5 mL 5ml sme 5mL 5ml 5mL .228 .088 1 0.271 773 1.444 11827 0.4 mL 0.6 mL 4.0...
Please answer #2. I'm unsure how its done ete od SOCK Solutions (the concentrations are known...
 Please answer #2. I'm unsure how its done
ete od SOCK Solutions (the concentrations are known you prepare will be used in assessing concent (0.07wv) to be used in developing a spectrophotometric assay for this drug. The standard curve your disposal a primary standard solution of the drug in sal w be used in assessing concentrations of the drug in samples having unknown concentrations. You have at this STD). The linear range of the assay for this drug a primary...
Please answer #2. I'm unsure how its done
ete od SOCK Solutions (the concentrations are known you prepare will be used in assessing concent (0.07wv) to be used in developing a spectrophotometric assay for this drug. The standard curve your disposal a primary standard solution of the drug in sal w be used in assessing concentrations of the drug in samples having unknown concentrations. You have at this STD). The linear range of the assay for this drug a primary...
2.(1 point) You have 125 μLof a protein sample. Of this, you dilute30μLinto 120μLof buffer. 50μL...
2.(1 point) You have 125 μLof a protein sample. Of this, you dilute30μLinto 120μLof buffer. 50μL of that dilution were used for a Bradford assay and produced an absorbance of 0.53.Using the standard curveyou built in the lab using BSA, find the protein concentration (in μg/μL) of the original protein sample. Show your work. (Hint: first find the dilution fold of the sample that was used for the assay.) Note: equation from standard curve: y=0.0093x + 0.1877 show all work.
Question 14 4 pts A protein assay was performed using the Bradford Reagent to determine the...
 Question 14 4 pts A protein assay was performed using the Bradford Reagent to determine the protein concentrations of a series of pet food extract samples. The BSA Standard Curve had a slope of 0.0173 Data obtained for the pet food are shown in the table below. Tubes 1-2 contained different volumes of the pet food extract. Tube # Volume Sample (UL) A(595) Volume Volume Water Reagent (3.0 (L) mL) 803 503 1 2 20 50 0.293 0.657 What is...
 Table 5. Drink mix concentrations and absorbances for constructing a standard curve Concentration Concentration Absorbance (mm) (M) Sample 1 0.51 Sample 2 Sample 3 Sample 4 How do I calculate to find (M)?
 5. The following data were obtained when Bio 106 students created solutions of the following concentrations (column 1), These students then placed three different samples of each concentration in a spectrophotometer and measured the absorbance. The following data table was created by these students. Create a standard curve from the data in the following table. Be sure to calculate the average absorbance for each concentration (round to two decimal places). After you have created the table, answer the following questions....
 Table 3: Absorbance for varying
concentrations of Co(NO3)2 at max
wavelength
Sample Number
Concentration (mM)
Absorbance
0
0 mM
0.00
1
30 mM
0.13
2
60 mM
0.27
3
90mM
0.40
4
120mM
0.53
5
150 mM
0.67
Answer the following questions based on your calibration curve
Calculate the
l value from the slope of your graph
Table 3: Absorbance for varying
concentrations of Co(NO3)2 at max
wavelength
Sample Number
Concentration (mM)
Absorbance
0
0 mM
0.00
1
30 mM
0.13
2
60 mM
0.27
3
90mM
0.40
4
120mM
0.53
5
150 mM
0.67
Answer the following questions based on your calibration curve
Calculate the
l value from the slope of your graph
 please help answer questions for mixture 1 AND mixture 2 thank
you!
Table 23.1 Test Tube Number 1 2 3 4 5 5,00 1.00 5.00 2.00 Volume Fe(NO), solution (ml.) Volume KSCN solution (ml.) Volume H,O (ml.) 5.00 3.00 2.00 5.00 4.00 5.00 5.00 0.00 4.00 3.00 1.00 Mixture 2 3 4 5 Absorbance 0.079 0.165 0.246 0.311 0.400 In order to convert the absorbance values provided below into equilibrium concentrations of FeSCN?, you will need to know the slope...
please help answer questions for mixture 1 AND mixture 2 thank
you!
Table 23.1 Test Tube Number 1 2 3 4 5 5,00 1.00 5.00 2.00 Volume Fe(NO), solution (ml.) Volume KSCN solution (ml.) Volume H,O (ml.) 5.00 3.00 2.00 5.00 4.00 5.00 5.00 0.00 4.00 3.00 1.00 Mixture 2 3 4 5 Absorbance 0.079 0.165 0.246 0.311 0.400 In order to convert the absorbance values provided below into equilibrium concentrations of FeSCN?, you will need to know the slope...
 PROCEDURE Table 4.1: Dilutions of Albumin for Standard Curve Determination. SAMPLE NUMBER VOLUME OF 0.9% NACL (mL) VOLUME OF 10 mg/ml ALBUMIN STOCK SOLUTION (mL) VOLUME OF BIURET REAGENT (mL) TOTAL VOLUME IN EACH TUBE ABSORBANCE READING ALBUMIN CONCENTRATION IN SOLUTION 1 (Blank) 1.0 mL OmL 4.0 mL 0.8 mL 0.2 mL 4.0 mL .4 0.6 mL 0.4 mL 4.0 mL 5 mL 5ml sme 5mL 5ml 5mL .228 .088 1 0.271 773 1.444 11827 0.4 mL 0.6 mL 4.0...
 Please answer #2. I'm unsure how its done
ete od SOCK Solutions (the concentrations are known you prepare will be used in assessing concent (0.07wv) to be used in developing a spectrophotometric assay for this drug. The standard curve your disposal a primary standard solution of the drug in sal w be used in assessing concentrations of the drug in samples having unknown concentrations. You have at this STD). The linear range of the assay for this drug a primary...
Please answer #2. I'm unsure how its done
ete od SOCK Solutions (the concentrations are known you prepare will be used in assessing concent (0.07wv) to be used in developing a spectrophotometric assay for this drug. The standard curve your disposal a primary standard solution of the drug in sal w be used in assessing concentrations of the drug in samples having unknown concentrations. You have at this STD). The linear range of the assay for this drug a primary...
 Question 14 4 pts A protein assay was performed using the Bradford Reagent to determine the protein concentrations of a series of pet food extract samples. The BSA Standard Curve had a slope of 0.0173 Data obtained for the pet food are shown in the table below. Tubes 1-2 contained different volumes of the pet food extract. Tube # Volume Sample (UL) A(595) Volume Volume Water Reagent (3.0 (L) mL) 803 503 1 2 20 50 0.293 0.657 What is...
Most questions answered within 3 hours.
-
Where is the error in this code sequence?
String s1 = "Hello";
String s2 = "ello";...
asked 1 year ago -
Financial data for Joel de Paris, Inc., for last year
follow:
Joel de Paris, Inc.
Balance...
asked 1 year ago -
Consider this reaction:
Al2(SO4)3 (aq)+ BaCl3
(aq) Al2Cl6 (aq)- +
3BaSO4(s) . What is the...
asked 1 year ago -
Suppose that Savneet is considering increasing her
recent random sample from 20 car rentals to 40...
asked 1 year ago -
Trucks arrive at an unloading terminal at an average rate of 120
per hour.
Trucks arrive...
asked 1 year ago -
Why are methanol and ethanol completely soluble in water while
octanol is not very little soluble....
asked 1 year ago -
A facilities manager at a university reads in a research report
that the mean amount of...
asked 1 year ago -
When the CuSO4 is rehydrated by adding water to the anhydrous
compound, is this an endothermic...
asked 1 year ago -
A ray of sunlight is passing from diamond into crown glass; the
angle of incidence is...
asked 1 year ago -
A block of mass 0.249 kg is placed on top of a light, vertical
spring of...
asked 1 year ago -
how do the kidneys compensate in the presences of acidosis
a) trigger hyperventilate
b) reserve acid...
asked 1 year ago -
Question 501 pts
The rental rate of capital to the firm increases. Which of the
following...
asked 1 year ago