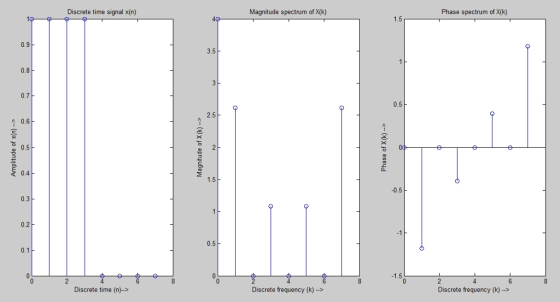
![Consider a finite length DT sequence of length N -16 described below. 1, 0<n< 2 Use MATLAB built-in function dftmtx (N), and compute X[k] command and create stem plots for the following: DFT(X[k]. Use subplot (a) x n] vs n; (b) X[k] vs k; (c) angle (X [k) vs k. Label axes of these plots and include title for each of these plots](http://img.homeworklib.com/questions/1e535460-f0bb-11eb-b0c1-a70af25a96c9.png?x-oss-process=image/resize,w_560)
Homework Answers
clear all;close all;clc;
N=8;
n=0:1:(N-1);
n1=0:1:((N/2)-1);
n2=(N/2):1:(N-1);
x1=ones(1,length(n1));
x2=zeros(1,length(n2));
x=[x1 x2];
X = x*dftmtx(N);
disp(X)
subplot(1,3,1)
stem(n,x);
xlabel('Discrete time (n)-->')
ylabel('Amplitude of x(n) -->')
title('Discrete time signal x(n)')
k=n;
subplot(1,3,2)
stem(k,abs(X));
xlabel('Discrete frequency (k) -->')
ylabel('Magnitude of X(k) -->')
title('Magnitude spectrum of X(k)')
subplot(1,3,3)
stem(k,angle(X));
xlabel('Discrete frequency (k) -->')
ylabel('Phase of X(k) -->')
title('Phase spectrum of X(k)')
x(n) = [1 1 1 1 0 0 0 0[
X(k) = [4 1 - 2.4142i 0 1 - 0.4142i 0 1 + 0.4142i 0 1 +
2.4142i]
Add Answer to:
Consider a finite length DT sequence of length N -16 described below. 1, 0<n< 2 Use...
Consider a sequence xln] 2-"uln], with its DTFT given by xlet y[n] be a finite-duration signal of...
 Consider a sequence xln] 2-"uln], with its DTFT given by xlet y[n] be a finite-duration signal of length 10. Suppose the 10-point DFT, Y[k], of y[n] is given by 10 equally-spaced samples of X(e). Determine y[n]. Hint: N-point DFT of a sequence w[n] = 2-n (u[n]-u[n-N]) is W [k] = 1-22 1wk
Consider a sequence xln] 2-"uln], with its DTFT given by xlet y[n] be a finite-duration signal of length 10. Suppose the 10-point DFT, Y[k], of y[n] is given...
Consider a sequence xln] 2-"uln], with its DTFT given by xlet y[n] be a finite-duration signal of length 10. Suppose the 10-point DFT, Y[k], of y[n] is given by 10 equally-spaced samples of X(e). Determine y[n]. Hint: N-point DFT of a sequence w[n] = 2-n (u[n]-u[n-N]) is W [k] = 1-22 1wk
Consider a sequence xln] 2-"uln], with its DTFT given by xlet y[n] be a finite-duration signal of length 10. Suppose the 10-point DFT, Y[k], of y[n] is given...
The DFT is a sampled version of the DTFT of a finite-length sequence; i.e., N-1 (P9.25-1)...
 The DFT is a sampled version of the DTFT of a finite-length sequence; i.e., N-1 (P9.25-1) Furthermore, an FFT algorithm is an efficient way to compute the values X Now consider a finite-length sequence xin] whose length is N samples.We want to evaluate X(z) the z-transform of the finite-length sequence, at the following points in the z-plane where ris a positive number. We have available an FFT algorithm (a) Plot the points z in the z-plane for the case N-8...
The DFT is a sampled version of the DTFT of a finite-length sequence; i.e., N-1 (P9.25-1) Furthermore, an FFT algorithm...
 The DFT is a sampled version of the DTFT of a finite-length sequence; i.e., N-1 (P9.25-1) Furthermore, an FFT algorithm is an efficient way to compute the values X Now consider a finite-length sequence xin] whose length is N samples.We want to evaluate X(z) the z-transform of the finite-length sequence, at the following points in the z-plane where ris a positive number. We have available an FFT algorithm (a) Plot the points z in the z-plane for the case N-8...
Don't use fplot command. Matlab code. Write out code please, don't make it a screenshot. 2....
 Don't use fplot command. Matlab code. Write out code please,
don't make it a screenshot.
2. Use the subplot command to make two plots of the function f(x) = (x + 1)(x - 2)(2x – 0.25) - et one graph for 0 < x <3 and the other for 3 < x < 6. Use a logarithmic scale for the y-axis. Include a plot title (for each subplot), and label both aris(for each subplot).
Don't use fplot command. Matlab code. Write out code please,
don't make it a screenshot.
2. Use the subplot command to make two plots of the function f(x) = (x + 1)(x - 2)(2x – 0.25) - et one graph for 0 < x <3 and the other for 3 < x < 6. Use a logarithmic scale for the y-axis. Include a plot title (for each subplot), and label both aris(for each subplot).
I Need Help with 4,6,8,10,15,18 Problems 123 If f(n) is a periodic sequence with period N,...
 I
Need Help with 4,6,8,10,15,18
Problems 123 If f(n) is a periodic sequence with period N, it is also periodic with period 2N. Tet 8(k) denote the DFS coefficients of X(n) considered as a periodic sequence with period N and X,(k) denote the DFS coefficients of x(n) considered as a periodic sequence with period 2N. X,(k) is, of course, periodic with period N and X2(k) is periodic with period 2N. Determine 8(k) in terms of X (k). 5. Consider two...
I
Need Help with 4,6,8,10,15,18
Problems 123 If f(n) is a periodic sequence with period N, it is also periodic with period 2N. Tet 8(k) denote the DFS coefficients of X(n) considered as a periodic sequence with period N and X,(k) denote the DFS coefficients of x(n) considered as a periodic sequence with period 2N. X,(k) is, of course, periodic with period N and X2(k) is periodic with period 2N. Determine 8(k) in terms of X (k). 5. Consider two...
8.32. Considera finite-duration sequence x[n] of length P such that xlnj=Ofor n <0andn> P. We want...
 8.32. Considera finite-duration sequence x[n] of length P such that xlnj=Ofor n <0andn> P. We want to compute samples of the Fourier transform at the N equally spaced frequencies 2nk Determine and justify procedures for computing the N samples of the Fourier transform using only one N-point DFT for the following two cases: (a) N > /P (b) N < P
Suppose the sequence x(n) = 5 * n-15, n-0,-. . , 16 is the input to...
 Suppose the sequence x(n) = 5 * n-15, n-0,-. . , 16 is the input to the filter with the impulse response h(n) = (2,5,1). (a) Compute the output y/i(n) using MATLAB. ] help (numbers). b) Use the overlap-save method to compute the filter output using MATLAB. Suppose L 5 new data points are employed in each block. Use MATLAB function ovrlpsav ] help (numbers). What is the filter size? help (numbers). What is the block size (the size of...
2- make two finite length real valued sequences, call them x[n] and y[n], such that each...
2- make two finite length real valued sequences, call them x[n] and y[n], such that each have 5 samples (not all zeros or the same values), then using convolution sum principal determine: a- correlation sequence of x vs. y b-correlation sequence of y vs. x compare/contrast the results. Note also you are to do part a and b by hand (use tabulation method) and then Matlab to verify your hand calculations
USE MATLAB 1.) Using subplot make 4 plots on 2 x 2 grid on different axes...
USE MATLAB 1.) Using subplot make 4 plots on 2 x 2 grid on different axes on one figure. Make 4 plots of sin(x) (each from x = 0 to x = 2pi ) to demonstrate how important it is to use the correct number data points the top-left plot will use 4 values of x the top-right plot will use 8 values of x the bottom left plot will use 16 values of x the bottom right plot will...
Exercise 4. Computing and displaying the Fourier Transform of a signal Later in the semester it will become useful to d...
 Exercise 4. Computing and displaying the Fourier Transform of a signal Later in the semester it will become useful to determine the frequency response of a signal or system by taking the Fourier Transform empirically (rather than computing it analytically). To do so we make use of the fft and fftshift commands. The fft command is an efficient implementation of the Discrete Fourier Transform (DFT) known as the Fast Fourier Transform (FFT). When the FFT is computed the samples are...
 Consider a sequence xln] 2-"uln], with its DTFT given by xlet y[n] be a finite-duration signal of length 10. Suppose the 10-point DFT, Y[k], of y[n] is given by 10 equally-spaced samples of X(e). Determine y[n]. Hint: N-point DFT of a sequence w[n] = 2-n (u[n]-u[n-N]) is W [k] = 1-22 1wk
Consider a sequence xln] 2-"uln], with its DTFT given by xlet y[n] be a finite-duration signal of length 10. Suppose the 10-point DFT, Y[k], of y[n] is given...
Consider a sequence xln] 2-"uln], with its DTFT given by xlet y[n] be a finite-duration signal of length 10. Suppose the 10-point DFT, Y[k], of y[n] is given by 10 equally-spaced samples of X(e). Determine y[n]. Hint: N-point DFT of a sequence w[n] = 2-n (u[n]-u[n-N]) is W [k] = 1-22 1wk
Consider a sequence xln] 2-"uln], with its DTFT given by xlet y[n] be a finite-duration signal of length 10. Suppose the 10-point DFT, Y[k], of y[n] is given...
 The DFT is a sampled version of the DTFT of a finite-length sequence; i.e., N-1 (P9.25-1) Furthermore, an FFT algorithm is an efficient way to compute the values X Now consider a finite-length sequence xin] whose length is N samples.We want to evaluate X(z) the z-transform of the finite-length sequence, at the following points in the z-plane where ris a positive number. We have available an FFT algorithm (a) Plot the points z in the z-plane for the case N-8...
 The DFT is a sampled version of the DTFT of a finite-length sequence; i.e., N-1 (P9.25-1) Furthermore, an FFT algorithm is an efficient way to compute the values X Now consider a finite-length sequence xin] whose length is N samples.We want to evaluate X(z) the z-transform of the finite-length sequence, at the following points in the z-plane where ris a positive number. We have available an FFT algorithm (a) Plot the points z in the z-plane for the case N-8...
 Don't use fplot command. Matlab code. Write out code please,
don't make it a screenshot.
2. Use the subplot command to make two plots of the function f(x) = (x + 1)(x - 2)(2x – 0.25) - et one graph for 0 < x <3 and the other for 3 < x < 6. Use a logarithmic scale for the y-axis. Include a plot title (for each subplot), and label both aris(for each subplot).
Don't use fplot command. Matlab code. Write out code please,
don't make it a screenshot.
2. Use the subplot command to make two plots of the function f(x) = (x + 1)(x - 2)(2x – 0.25) - et one graph for 0 < x <3 and the other for 3 < x < 6. Use a logarithmic scale for the y-axis. Include a plot title (for each subplot), and label both aris(for each subplot).
 I
Need Help with 4,6,8,10,15,18
Problems 123 If f(n) is a periodic sequence with period N, it is also periodic with period 2N. Tet 8(k) denote the DFS coefficients of X(n) considered as a periodic sequence with period N and X,(k) denote the DFS coefficients of x(n) considered as a periodic sequence with period 2N. X,(k) is, of course, periodic with period N and X2(k) is periodic with period 2N. Determine 8(k) in terms of X (k). 5. Consider two...
I
Need Help with 4,6,8,10,15,18
Problems 123 If f(n) is a periodic sequence with period N, it is also periodic with period 2N. Tet 8(k) denote the DFS coefficients of X(n) considered as a periodic sequence with period N and X,(k) denote the DFS coefficients of x(n) considered as a periodic sequence with period 2N. X,(k) is, of course, periodic with period N and X2(k) is periodic with period 2N. Determine 8(k) in terms of X (k). 5. Consider two...
 8.32. Considera finite-duration sequence x[n] of length P such that xlnj=Ofor n <0andn> P. We want to compute samples of the Fourier transform at the N equally spaced frequencies 2nk Determine and justify procedures for computing the N samples of the Fourier transform using only one N-point DFT for the following two cases: (a) N > /P (b) N < P
 Suppose the sequence x(n) = 5 * n-15, n-0,-. . , 16 is the input to the filter with the impulse response h(n) = (2,5,1). (a) Compute the output y/i(n) using MATLAB. ] help (numbers). b) Use the overlap-save method to compute the filter output using MATLAB. Suppose L 5 new data points are employed in each block. Use MATLAB function ovrlpsav ] help (numbers). What is the filter size? help (numbers). What is the block size (the size of...
 Exercise 4. Computing and displaying the Fourier Transform of a signal Later in the semester it will become useful to determine the frequency response of a signal or system by taking the Fourier Transform empirically (rather than computing it analytically). To do so we make use of the fft and fftshift commands. The fft command is an efficient implementation of the Discrete Fourier Transform (DFT) known as the Fast Fourier Transform (FFT). When the FFT is computed the samples are...
Most questions answered within 3 hours.
-
Where is the error in this code sequence?
String s1 = "Hello";
String s2 = "ello";...
asked 11 months ago -
Financial data for Joel de Paris, Inc., for last year
follow:
Joel de Paris, Inc.
Balance...
asked 11 months ago -
Consider this reaction:
Al2(SO4)3 (aq)+ BaCl3
(aq) Al2Cl6 (aq)- +
3BaSO4(s) . What is the...
asked 11 months ago -
Suppose that Savneet is considering increasing her
recent random sample from 20 car rentals to 40...
asked 11 months ago -
Trucks arrive at an unloading terminal at an average rate of 120
per hour.
Trucks arrive...
asked 11 months ago -
Why are methanol and ethanol completely soluble in water while
octanol is not very little soluble....
asked 11 months ago -
A facilities manager at a university reads in a research report
that the mean amount of...
asked 11 months ago -
When the CuSO4 is rehydrated by adding water to the anhydrous
compound, is this an endothermic...
asked 11 months ago -
A ray of sunlight is passing from diamond into crown glass; the
angle of incidence is...
asked 11 months ago -
A block of mass 0.249 kg is placed on top of a light, vertical
spring of...
asked 11 months ago -
how do the kidneys compensate in the presences of acidosis
a) trigger hyperventilate
b) reserve acid...
asked 11 months ago -
Question 501 pts
The rental rate of capital to the firm increases. Which of the
following...
asked 11 months ago