
Homework Answers
***please ask if you have any doubts.Happy to help you.Thank you.Please Like.
Add Answer to:
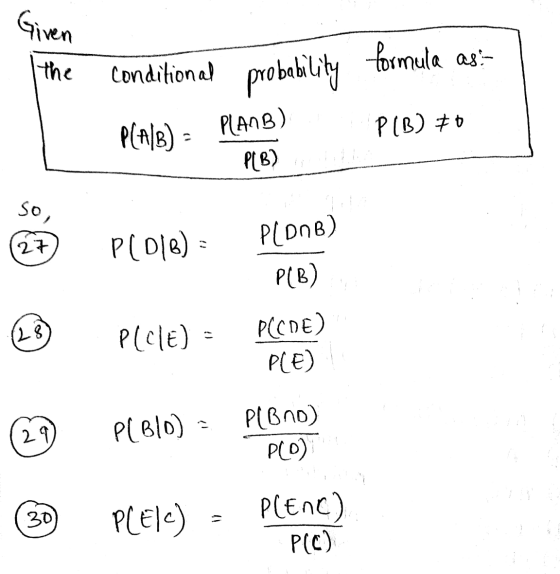
Probability questions 28 and 30
In Problems 27-34, compute each probability using formula (1) on page...
Consider a sample with data values of 27, 25, 20, 15, 30, 34, 28, and 25....
Consider a sample with data values of 27, 25, 20, 15, 30, 34, 28, and 25. Compute the 22nd, 27th, 64th, and 74th percentiles. If needed, round your answers to two decimal digits.
Consider a sample with data values of 27, 25, 20, 15, 30, 34, 28, and 25....
Consider a sample with data values of 27, 25, 20, 15, 30, 34, 28, and 25. Compute the 19th, 24th, 66th, and 76th percentiles. If needed, round your answers to two decimal digits. Percentile Value 19% 24% 66% 76%
Consider a sample with data values of 27, 25, 20, 15, 30, 34, 28, and 25....
 Consider a sample with data values of 27, 25, 20, 15, 30, 34, 28, and 25. Compute the 19th, 24th, 60th, and 70th percentiles. If needed, round your answers to two decimal digits Percentile Value 1996 2496 60% 70%
Compute P(X) using the binomial probability formula. Then determine whether the normal distribution can be used...
Compute P(X) using the binomial probability formula. Then determine whether the normal distribution can be used to estimate this probability. If so, approximate P(X) using the normal distribution and compare the result with the exact probability. n=56, p=0.7, and X=34. find P(X).
Spring disk No till Spring Chisele Great Lakes Bt 32 30 33 35 34 34 30...
 Spring disk No till Spring Chisele Great Lakes Bt 32 30 33 35 34 34 30 26 29 32 25 29 30 32 26 28 31 29 28 32 27 30 29 27 2. Waiting for a Table. The following data represent the number of customers waiting for a table at 6:00pm on Saturday for 40 consecutive Saturdays at Bubba's restaurant. Select a random sample of these waiting times where n=5. Using your randomly selected sample of times, compute the...
1 2 3 5 6 7 8 9 10 4 40 Total Normal 39 28 27...
 1 2 3 5 6 7 8 9 10 4 40 Total Normal 39 28 27 25 28 42 35 34 37 335 Polka-dot 28 29 30 28 33 37 30 32 42 29 318 Use the chi-square test to determine if the total observed gametophyte phenotypes follow Mendel's expectations. To complete this evaluation, in the below table, enter the total observed values for Normal and Polka-dot phenotypes. Next, select the expected ratio values (here 1:1). Then click on the...
Answer the within-subjects ANOVA questions using the data below. Use α = 0.01. 1 2 3...
Answer the within-subjects ANOVA questions using the data below. Use α = 0.01. 1 2 3 4 53 49 47 42 51 39 44 44 39 36 34 39 30 29 46 42 39 37 36 34 26 44 35 30 27 33 28 31 a) Compute the preliminary statistics below. SSBG = ; dfBG = SSBS = ; dfBS = SSE = ; dfE = SST = ; dfT = b) Compute the appropriate test statistic(s) to make a decision about H0. critical...
Compute PIX) using the binomial probability formula. Then determine whether the normal distribution can be used...
 Compute PIX) using the binomial probability formula. Then determine whether the normal distribution can be used to estimate this probability. If so, approximate PX) using the normal distribution and compare the result with the exact probability n=47, p=0.5, and X = 21 For n = 47. p=0.5, and X = 21, use the binomial probability formula to find PC 0.0892 (Round to four decimal places as needed) Can the normal distribution be used to approximate this probability? O A. Yes,...
USING EXCEL Question Set 3. This question set uses the metropolitan model for facility location decisions....
USING EXCEL Question Set 3. This question set uses the metropolitan model for facility location decisions. Each demand source has a weight indicating the volume of sales it is expected to generate. Using the demand data and five potential locations on the following page: 1. Find the sum of weighted metropolitan model distances for each of the five locations. Be sure the calculations are shown for each location’s sum of distances. (8pts) 2. As evidenced by having the smallest weighted...
Compute the probability of x successes using the binomial formula. Round your answers to three decimal...
Compute the probability of x successes using the binomial formula. Round your answers to three decimal places as needed. n = 3, p = 0.04, X = 1
 Consider a sample with data values of 27, 25, 20, 15, 30, 34, 28, and 25. Compute the 19th, 24th, 60th, and 70th percentiles. If needed, round your answers to two decimal digits Percentile Value 1996 2496 60% 70%
 Spring disk No till Spring Chisele Great Lakes Bt 32 30 33 35 34 34 30 26 29 32 25 29 30 32 26 28 31 29 28 32 27 30 29 27 2. Waiting for a Table. The following data represent the number of customers waiting for a table at 6:00pm on Saturday for 40 consecutive Saturdays at Bubba's restaurant. Select a random sample of these waiting times where n=5. Using your randomly selected sample of times, compute the...
 1 2 3 5 6 7 8 9 10 4 40 Total Normal 39 28 27 25 28 42 35 34 37 335 Polka-dot 28 29 30 28 33 37 30 32 42 29 318 Use the chi-square test to determine if the total observed gametophyte phenotypes follow Mendel's expectations. To complete this evaluation, in the below table, enter the total observed values for Normal and Polka-dot phenotypes. Next, select the expected ratio values (here 1:1). Then click on the...
 Compute PIX) using the binomial probability formula. Then determine whether the normal distribution can be used to estimate this probability. If so, approximate PX) using the normal distribution and compare the result with the exact probability n=47, p=0.5, and X = 21 For n = 47. p=0.5, and X = 21, use the binomial probability formula to find PC 0.0892 (Round to four decimal places as needed) Can the normal distribution be used to approximate this probability? O A. Yes,...
Most questions answered within 3 hours.
-
Where is the error in this code sequence?
String s1 = "Hello";
String s2 = "ello";...
asked 10 months ago -
Financial data for Joel de Paris, Inc., for last year
follow:
Joel de Paris, Inc.
Balance...
asked 10 months ago -
Consider this reaction:
Al2(SO4)3 (aq)+ BaCl3
(aq) Al2Cl6 (aq)- +
3BaSO4(s) . What is the...
asked 10 months ago -
Suppose that Savneet is considering increasing her
recent random sample from 20 car rentals to 40...
asked 10 months ago -
Trucks arrive at an unloading terminal at an average rate of 120
per hour.
Trucks arrive...
asked 10 months ago -
Why are methanol and ethanol completely soluble in water while
octanol is not very little soluble....
asked 10 months ago -
A facilities manager at a university reads in a research report
that the mean amount of...
asked 10 months ago -
When the CuSO4 is rehydrated by adding water to the anhydrous
compound, is this an endothermic...
asked 10 months ago -
A ray of sunlight is passing from diamond into crown glass; the
angle of incidence is...
asked 10 months ago -
A block of mass 0.249 kg is placed on top of a light, vertical
spring of...
asked 10 months ago -
how do the kidneys compensate in the presences of acidosis
a) trigger hyperventilate
b) reserve acid...
asked 10 months ago -
Question 501 pts
The rental rate of capital to the firm increases. Which of the
following...
asked 10 months ago