I need help with number 12 giving the information in the graph [12] For this set...
I need help with number 12 giving the information in the graph
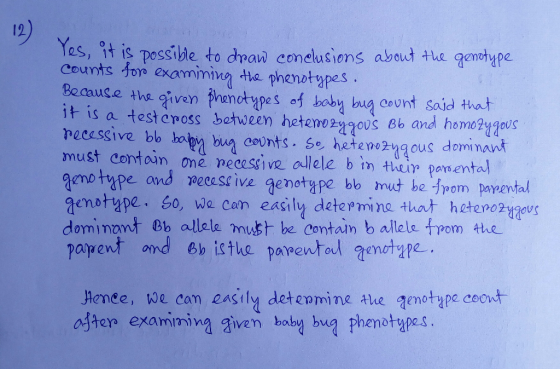
[12] For this set of parents, is it possible to draw conclusions about the genotype counts from examining the phenotypes? Why or why not? Use counts from one of your bb vs Bb data runs as part of your discussion.
Procedure I - Part C - Baby bugs when parents are bb and Bb
Data Table - Enter your Baby Bug Counts from each data run
|
Data Run |
BB Baby Bug Count |
Bb Baby Bug Count |
bb Baby Bug Count |
|
1 |
0 |
7 |
3 |
|
2 |
0 |
3 |
7 |
|
3 |
0 |
7 |
3 |
|
4 |
0 |
4 |
6 |
|
5 |
0 |
6 |
4 |
|
6 |
0 |
3 |
7 |
|
7 |
0 |
5 |
5 |
|
8 |
0 |
3 |
7 |
|
9 |
0 |
3 |
7 |
|
10 |
0 |
9 |
1 |
Data Averages Table - Enter your average Baby Bug Counts
Tip: BB Baby Bug Count Average = Sum of BB Baby Bug Counts / Number of Data Runs
|
BB Baby Bug Count Average |
Bb Baby Bug Count Average |
bb Baby Bug Count Average |
|
0 |
50 |
50 |
Percentage Tables - Enter the Baby Bug percentages
Tip: Baby Bug Percent = 100% ´ (Baby Bug Count Average) / (Total Number of Baby Bugs)
|
BB Baby Bug Percentage |
Bb Baby Bug Percentage |
bb Baby Bug Percentage |
|
0% |
50% |
50% |
Tip: Blue Rimmed Baby Bug Percentage = BB Baby Bug Percent + Bb Baby Bug Percent
|
Blue Rimmed Baby Bug Percentage |
Yellow Rimmed Baby Bug Percentage |
|
50% |
50% |
Observations and Questions
[10] Complete the Punnett square below when the parents are bb and Bb.
|
Punnett Square |
Male |
||
|
Female |
Alleles/Genes |
B |
b |
|
b |
Bb |
bb |
|
|
b |
Bb |
bb |
|
Homework Answers
Add Answer to:
I need help with number 12 giving the information in the
graph
[12] For this set...
Procedure I - Part D - Baby bugs when parents are Bb and Bb Data Table...
Procedure I - Part D - Baby bugs when parents are Bb and Bb Data Table - Enter your Baby Bug Counts from each data run Data Run BB Baby Bug Count Bb Baby Bug Count bb Baby Bug Count 1 3 3 4 2 3 6 1 3 0 9 1 4 1 8 1 5 4 5 1 6 1 6 3 7 4 3 3 8 2 4 4 9 2 6 2 10 3 4 3...
I need help with filling in the remaining gaps and answering questions 16-19 Procedure II -...
I need help with filling in the remaining gaps and answering questions 16-19 Procedure II - Part A - Bug Population changes when there is a breeding preference for blue rimmed bugs Data Table - Enter your Final Bug Counts BB Bug Count Bb Bug Count bb Bug Count 19 1 0 Percentage Tables - Enter the Final Bug percentages Tip: Bug Type Percentage = 100% ´ (Bug Type Count) / (Total Number of Bugs) BB Bug Percentage Bb Bug...
I need help Bug Population changes when there is a breeding preference for blue rimmed bugs...
I need help Bug Population changes when there is a breeding preference for blue rimmed bugs Data Table - Enter your Final Bug Counts BB Bug Count Bb Bug Count bb Bug Count 20 0 0 Percentage Tables - Enter the Final Bug percentages : Bug Type Percentage = 100% ´ (Bug Type Count) / (Total Number of Bugs) BB Bug Percentage Bb Bug Percentage bb Bug Percentage 100% 0 0 Tip: Blue Rimmed Baby Bug Percentage = BB...
Data Run BB Baby Bug Count Bb Baby Bug Count bb Baby Bug Count 1 5...
Data Run BB Baby Bug Count Bb Baby Bug Count bb Baby Bug Count 1 5 3 2 2 1 6 3 3 2 5 3 4 3 6 1 5 2 7 1 6 3 5 2 7 3 4 3 8 4 4 2 9 5 4 1 10 2 6 2 Procedure II - Part A - Bug Population changes when there is a breeding preference for blue rimmed bugs Data Table - Enter your Final Bug...
[12] For this set of parents, is it possible to draw conclusions about the genotype counts...
[12] For this set of parents, is it possible to draw conclusions about the genotype counts from examining the phenotypes? Why or why not? Use counts from one of your bb vs Bb data runs as part of your discussion. Punnett Square Male Female Alleles/Genes B b b Bb bb b Bb bb
Help with 3,4,5,7 & 8! Biological Variability Fill in Data Table 1 with the number of...
 Help with 3,4,5,7 & 8!
Biological Variability Fill in Data Table 1 with the number of sow bugs your team observed in the light after the indicated times. Then fill in the deduced number of sow bugs that were in the dark at each of those times. Data Table 1. Sow Bug Team Data (1 pt.) Time in Minutes 0 1 2345 6 7 8910 Trial #1 Number| 5 | 4 | 3 in Dark Number 5 5 in Light...
Help with 3,4,5,7 & 8!
Biological Variability Fill in Data Table 1 with the number of sow bugs your team observed in the light after the indicated times. Then fill in the deduced number of sow bugs that were in the dark at each of those times. Data Table 1. Sow Bug Team Data (1 pt.) Time in Minutes 0 1 2345 6 7 8910 Trial #1 Number| 5 | 4 | 3 in Dark Number 5 5 in Light...
Need 5-9 and number 11 all answered. Thx 5. How can two individuals with brown eyes(B)...
 Need 5-9 and number 11 all answered. Thx
5. How can two individuals with brown eyes(B) have a blue (b) eyed baby? Show the genotypes of the parents and Punnett square to prove your answer. What are the chances of a blue-eyed baby? 6. A homozygous tongue roller (T) is married to a non-tongue roller(t). If they have 5 children, how many of them will be tongue rollers? Use Punnett square to support and explain your answer. 7. Let's imagine...
Need 5-9 and number 11 all answered. Thx
5. How can two individuals with brown eyes(B) have a blue (b) eyed baby? Show the genotypes of the parents and Punnett square to prove your answer. What are the chances of a blue-eyed baby? 6. A homozygous tongue roller (T) is married to a non-tongue roller(t). If they have 5 children, how many of them will be tongue rollers? Use Punnett square to support and explain your answer. 7. Let's imagine...
1. What would be the phenotype for each of the following birds, including their gender? Color...
1. What would be the phenotype for each of the following birds, including their gender? Color Gender Bb ZZi: - bb ZiZi: - BB ZZ: - bb ZW: - Bb ZiW: - 2. Using the phenotypes of the parents and of the progeny given in table 1, determine the genotype of each parent in the first nest. Male Female 3. Using the phenotypes of the parents and of the progeny given in table 2, determine the genotype of each parent...
I need help with this Java problem, please. Code must be written in Java Create an...
I need help with this Java problem, please. Code must be written in Java Create an application that calculates batting statistics for baseball players. Console Welcome to the Batting Average Calculator Enter number of times at bat: 5 0 = out, 1 = single, 2 = double, 3 = triple, 4 = home run Result for at-bat 1: 0 Result for at-bat 2: 1 Result for at-bat 3: 0 Result for at-bat 4: 2 Result for at-bat 5: 3 Batting...
please help. i figured out the chart but i need help with b-e. on the percentage...
 please help. i figured out the chart but i need help
with b-e.
on the percentage of games won by a team the following data show the average number of passing yards per attempt (Yards/Attempt) and The National Football League (NFL) records a variety of performance data for individuals and teams. To investigate the importance of passing the percentage of games won (WinPct) for a random sample of 10 NFL teams for the 2011 season, DATAfie: NFLPassing Team Yards/Attempt WinPct...
please help. i figured out the chart but i need help
with b-e.
on the percentage of games won by a team the following data show the average number of passing yards per attempt (Yards/Attempt) and The National Football League (NFL) records a variety of performance data for individuals and teams. To investigate the importance of passing the percentage of games won (WinPct) for a random sample of 10 NFL teams for the 2011 season, DATAfie: NFLPassing Team Yards/Attempt WinPct...
 Help with 3,4,5,7 & 8!
Biological Variability Fill in Data Table 1 with the number of sow bugs your team observed in the light after the indicated times. Then fill in the deduced number of sow bugs that were in the dark at each of those times. Data Table 1. Sow Bug Team Data (1 pt.) Time in Minutes 0 1 2345 6 7 8910 Trial #1 Number| 5 | 4 | 3 in Dark Number 5 5 in Light...
Help with 3,4,5,7 & 8!
Biological Variability Fill in Data Table 1 with the number of sow bugs your team observed in the light after the indicated times. Then fill in the deduced number of sow bugs that were in the dark at each of those times. Data Table 1. Sow Bug Team Data (1 pt.) Time in Minutes 0 1 2345 6 7 8910 Trial #1 Number| 5 | 4 | 3 in Dark Number 5 5 in Light...
 Need 5-9 and number 11 all answered. Thx
5. How can two individuals with brown eyes(B) have a blue (b) eyed baby? Show the genotypes of the parents and Punnett square to prove your answer. What are the chances of a blue-eyed baby? 6. A homozygous tongue roller (T) is married to a non-tongue roller(t). If they have 5 children, how many of them will be tongue rollers? Use Punnett square to support and explain your answer. 7. Let's imagine...
Need 5-9 and number 11 all answered. Thx
5. How can two individuals with brown eyes(B) have a blue (b) eyed baby? Show the genotypes of the parents and Punnett square to prove your answer. What are the chances of a blue-eyed baby? 6. A homozygous tongue roller (T) is married to a non-tongue roller(t). If they have 5 children, how many of them will be tongue rollers? Use Punnett square to support and explain your answer. 7. Let's imagine...
 please help. i figured out the chart but i need help
with b-e.
on the percentage of games won by a team the following data show the average number of passing yards per attempt (Yards/Attempt) and The National Football League (NFL) records a variety of performance data for individuals and teams. To investigate the importance of passing the percentage of games won (WinPct) for a random sample of 10 NFL teams for the 2011 season, DATAfie: NFLPassing Team Yards/Attempt WinPct...
please help. i figured out the chart but i need help
with b-e.
on the percentage of games won by a team the following data show the average number of passing yards per attempt (Yards/Attempt) and The National Football League (NFL) records a variety of performance data for individuals and teams. To investigate the importance of passing the percentage of games won (WinPct) for a random sample of 10 NFL teams for the 2011 season, DATAfie: NFLPassing Team Yards/Attempt WinPct...
Most questions answered within 3 hours.
-
Where is the error in this code sequence?
String s1 = "Hello";
String s2 = "ello";...
asked 10 months ago -
Financial data for Joel de Paris, Inc., for last year
follow:
Joel de Paris, Inc.
Balance...
asked 10 months ago -
Consider this reaction:
Al2(SO4)3 (aq)+ BaCl3
(aq) Al2Cl6 (aq)- +
3BaSO4(s) . What is the...
asked 10 months ago -
Suppose that Savneet is considering increasing her
recent random sample from 20 car rentals to 40...
asked 10 months ago -
Trucks arrive at an unloading terminal at an average rate of 120
per hour.
Trucks arrive...
asked 10 months ago -
Why are methanol and ethanol completely soluble in water while
octanol is not very little soluble....
asked 10 months ago -
A facilities manager at a university reads in a research report
that the mean amount of...
asked 10 months ago -
When the CuSO4 is rehydrated by adding water to the anhydrous
compound, is this an endothermic...
asked 10 months ago -
A ray of sunlight is passing from diamond into crown glass; the
angle of incidence is...
asked 10 months ago -
A block of mass 0.249 kg is placed on top of a light, vertical
spring of...
asked 10 months ago -
how do the kidneys compensate in the presences of acidosis
a) trigger hyperventilate
b) reserve acid...
asked 10 months ago -
Question 501 pts
The rental rate of capital to the firm increases. Which of the
following...
asked 10 months ago