Explain and demonstrate graphically, the short-run and long-run effects of an increase in the money supply...
Homework Answers
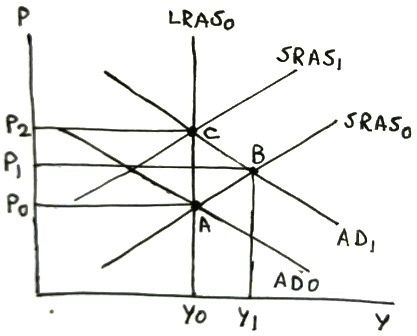
An increase in money supply lowers interest rate, which increases investment demand and the component of consumption demand that is funded by borrowing. This increases aggregate demand. AD curve will shift to right, increasing both price level and real GDP, resulting in a short-run inflationary gap.
In the long run, higher price level increases input costs, raising production costs. Hence firms decrease production, lowering aggregate supply. SRAS curve shifts leftward, intersecting new AD curve at further higher price level but restoring real GDP to potential GDP level, and eliminating expansionary gap.
In following graph, initial long-run equilibrium is at point A where AD0 (aggregate demand), LRAS0 (long-run aggregate supply) and SRAS0 (short-run aggregate supply) curves intersect, with initial long-run equilibrium price level P0 and initial equilibrium real GDP (= Potential GDP) Y0. When higher consumption and investment increases aggregate demand, AD curve will shift rightward from AD0 to AD1, intersecting SRAS0 at point B with higher price level P1 and higher real GDP Y1, with inflationary gap being equal to (Y1 - Y0) in short run. In long run, SRAS0 shifts left to SRAS1, intersecting AD1 at point C with further higher price level P2 and restoring real GDP to potential GDP level Y0, eliminating short-run inflationary gap.
Add Answer to:
Explain and demonstrate graphically, the short-run and
long-run effects of an increase in the money supply...
7. (10 Points) Explain and demonstrate graphically the effects of a negative supply shock in both the short-run and long-run. (Hint: Use AD-AS framework) 7. (10 Points) Explain and demonstrate g...
 7. (10 Points) Explain and demonstrate graphically the effects of a negative supply shock in both the short-run and long-run. (Hint: Use AD-AS framework)
7. (10 Points) Explain and demonstrate graphically the effects of a negative supply shock in both the short-run and long-run. (Hint: Use AD-AS framework)
7. (10 Points) Explain and demonstrate graphically the effects of a negative supply shock in both the short-run and long-run. (Hint: Use AD-AS framework)
Using aggregate demand (AD), short-run aggregate supply (SRAS) and long-run aggregate supply (LRAS) curves
Question 1: AD-SRAS-LRAS Model Using aggregate demand (AD), short-run aggregate supply (SRAS) and long-run aggregate supply (LRAS) curves, graphically illustrate the effect of an increase in the money supply on output and prices in the short and long run. Assume that the economy is initially in long run equilibrium at the potential output level and prices are fixed in the short-run. In your graph, label "A" for the initial equilibrium, "B' for the short-run equilibrium, and "C" for the long-run equilibrium.
Graphically illustrate the short-run effects of an increase in financial frictions.
Graphically illustrate the short-run effects of an increase in financial frictions.
Which of the following will increase both the short-run and long-run aggregate supply curves? A. There...
Which of the following will increase both the short-run and long-run aggregate supply curves? A. There are fewer firms involved in perfectly competitive and monopolistically competitive market structures as the economy features more oligopolies than before. B. The wage rate temporarily decreases throughout the economy. C. Younger workers in the labour force receive better and more training than their predecessors. D. The supply of key raw materials, such as petroleum and bauxite, is reduced. Which of the following is true...
52. Graphically demonstrate the effect of each of the following on either the short-run aggregate supply...
 52. Graphically demonstrate the effect of each of the following on either the short-run aggregate supply (SAS) curve or the long-run aggregate supply (LAS) curve. Be sure to label all axes u Businesses find that they are unable to produce more iq. output without having to pay more wages or increasing their costs of capital. ir. Productivity rises by 3% and input prices rise by 5%. is. A forest fire destroys a significant portion of Canada. it. The country's currency...
11. Demonstrate the tax increase using the closed AD-AS model, ceteris paribus, after the initial short-run...
11. Demonstrate the tax increase using the closed AD-AS model, ceteris paribus, after the initial short-run shock (i.e., decrease in wealth), but before the nominal wages and prices are fully flexible. [Note: this is the counterfactual version.] [Sub-questions 11-12 are connected.] After the tax increase, _______ shifts_______. A. the aggregate demand curve; leftward B. the aggregate demand curve; rightward C. the short-run aggregate supply curve; leftward D. the short-run aggregate supply curve; rightward E. the long-run aggregate supply curve; leftward...
Use an AD and AS graph (and words) to explain the short-run and long-run effects on...
Use an AD and AS graph (and words) to explain the short-run and long-run effects on real GDP and price level of a decrease in net exports. Assume the economy begins at full employment. Be sure to state what happens to price level and Real GDP in both the short-run and long-run and how the economy transitions from short to long-run. (YOU MUST DRAW A GRAPH)
(a) There are three reasons commonly given for the upward slope of the Short Run Aggregate...
(a) There are three reasons commonly given for the upward slope of the Short Run Aggregate Supply curve. Clearly explain all of them. (3 marks) (a) Using an AD/AS model, explain the effects on both prices and output in the short and long run, if there is an increase in the overall wage rate in an economy. (7 marks)
1. Using equilibrium in the "money market” graphically demonstrate the effect of increasing the money supply...
 1. Using equilibrium in the "money market” graphically demonstrate the effect of increasing the money supply in a liquidity trap. (5 pts)
what is the difference between the short run and the long run equilibrium in the AD-AS...
 what is the difference between the short run and the long run equilibrium in the AD-AS 6. The economy is in a deep recession. In order to close the output gap, the government is planning on sending a cheque (money) to all households. Explain the short-run and the long run impact of this intervention using the ADAS model. 7. Explain in plain words how the impact of the fiscal policy described above depends on the slope of the AS curve....
 7. (10 Points) Explain and demonstrate graphically the effects of a negative supply shock in both the short-run and long-run. (Hint: Use AD-AS framework)
7. (10 Points) Explain and demonstrate graphically the effects of a negative supply shock in both the short-run and long-run. (Hint: Use AD-AS framework)
7. (10 Points) Explain and demonstrate graphically the effects of a negative supply shock in both the short-run and long-run. (Hint: Use AD-AS framework)
 52. Graphically demonstrate the effect of each of the following on either the short-run aggregate supply (SAS) curve or the long-run aggregate supply (LAS) curve. Be sure to label all axes u Businesses find that they are unable to produce more iq. output without having to pay more wages or increasing their costs of capital. ir. Productivity rises by 3% and input prices rise by 5%. is. A forest fire destroys a significant portion of Canada. it. The country's currency...
 1. Using equilibrium in the "money market” graphically demonstrate the effect of increasing the money supply in a liquidity trap. (5 pts)
 what is the difference between the short run and the long run equilibrium in the AD-AS 6. The economy is in a deep recession. In order to close the output gap, the government is planning on sending a cheque (money) to all households. Explain the short-run and the long run impact of this intervention using the ADAS model. 7. Explain in plain words how the impact of the fiscal policy described above depends on the slope of the AS curve....
Most questions answered within 3 hours.
-
Where is the error in this code sequence?
String s1 = "Hello";
String s2 = "ello";...
asked 11 months ago -
Financial data for Joel de Paris, Inc., for last year
follow:
Joel de Paris, Inc.
Balance...
asked 11 months ago -
Consider this reaction:
Al2(SO4)3 (aq)+ BaCl3
(aq) Al2Cl6 (aq)- +
3BaSO4(s) . What is the...
asked 11 months ago -
Suppose that Savneet is considering increasing her
recent random sample from 20 car rentals to 40...
asked 11 months ago -
Trucks arrive at an unloading terminal at an average rate of 120
per hour.
Trucks arrive...
asked 11 months ago -
Why are methanol and ethanol completely soluble in water while
octanol is not very little soluble....
asked 11 months ago -
A facilities manager at a university reads in a research report
that the mean amount of...
asked 11 months ago -
When the CuSO4 is rehydrated by adding water to the anhydrous
compound, is this an endothermic...
asked 11 months ago -
A ray of sunlight is passing from diamond into crown glass; the
angle of incidence is...
asked 11 months ago -
A block of mass 0.249 kg is placed on top of a light, vertical
spring of...
asked 11 months ago -
how do the kidneys compensate in the presences of acidosis
a) trigger hyperventilate
b) reserve acid...
asked 11 months ago -
Question 501 pts
The rental rate of capital to the firm increases. Which of the
following...
asked 11 months ago