(10) A person earns a wage $10 per hour and has 100 hours per week to...
(10) A person earns a wage $10 per hour and has 100 hours per week to allocate between leisure and work. At the $10 wage, the person chooses to consume 65 hours of leisure per week.
a. Draw the labor-leisure graph showing the situation described above. Make sure to label all intercepts, axis, and relevant slopes in your graph.
b.The wage increases to $15 per hour. Assume the substitution effect exceeds the income effect. Show on your graph whether the person works more or less with the wage increase.
c.You receive a $50 weekly cash allowance from a college scholarship fund. Show the effect of the scholarship on your budget constraint. Do you work more, less, or the same? Explain.
Homework Answers
a) If person works for 35 hours he get 350 in
income and 65 hours in Leisure which depicts the Budget constraint
in the below diagram.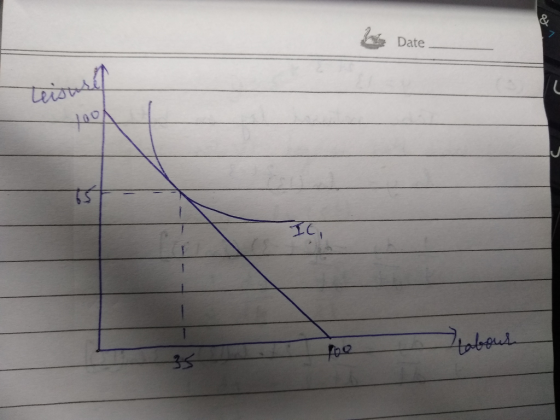
b) When the wage rises to $15, the budget
constraint shifts rightward toward income from labour. Now the
income level is 525. The indifference curve is also shifted
rightwards which shows the income and substitution effect in the
diagram. Person works approximately the same when the income rises
to $15, labour hours rises but after some level of working hard,
they increase their leisure hours.
c) If you get a $50 weekly cash allowance which is one time payment which shifts your budget constraint rightwards by $50. The consumption of labour as well as leisure rises.

Add Answer to:
(10) A person earns a wage $10 per hour and has 100 hours per
week to...
Emma’s wage rate is $10 per hour and she has a maximum of 100 hours per...
Emma’s wage rate is $10 per hour and she has a maximum of 100 hours per week to allocate between leisure and work. In the absence of any tax on wage earnings, Emma optimally chooses to work 40 hours per week. The following tax is imposed. Emma is not taxed on the first $240 earnings per week, but each dollar earned beyond that is taxed at 10%. Does the tax cause Emma to work more, work less, or have no...
Alex earns a wage of 15 an hour if he works up to forty hours per...
Alex earns a wage of 15 an hour if he works up to forty hours per week. however,for every hours, alex works in excess of 40 he earns a wage of 30 an hour。 Alex also faces a 20% tax rate and pays child-care expenses of 4 for every hour he works. He also receives a child support payment of 80 per week. He has a total of 110 hours per week that he can dedicate to work and leisure....
Pat's wage rate is $6 per hour and she has a maximum of 100 hours per...
 Pat's wage rate is $6 per hour and she has a maximum of 100 hours per week to allocate between leisure and work. Without any welfare assistance program, Pat chooses to work 37.5 hours per week. a. Suppose Pat is eligible for welfare benefits of $225 per week, but benefits are reduced $1 for every $1 she earns. Draw the budget line (label all relevant values) and indifference curve that represents Pat's maximum utility under these circumstances. b. The structure...
1. Jack earns $20 per hour and he gets an allowance of $100 per week. He...
 1. Jack earns $20 per hour and he gets an allowance of $100 per week. He has 168 hours per week to spend on work and leisure. The price of consumption goods is normalized to $1. a. Draw Jack's budget line. (Label axis, give numbers for intercepts; indicate the magnitude of slope) (10 pts) b. If Jack could earn $30 per hour, how the budget line change? Show the new budget line in the graph from a). (Label axis, give...
A person chooses between leisure and consumption. All of their consumption comes from current income. The...
 A person chooses between leisure and consumption. All of their consumption comes from current income. The utility derived from any combination of leisure and consumption is given by U- YL-88Y where U is utility, L is the hours of leisure per week and Yis the number of dollars of income all of which will be spent on consumption. The person can work as many hours as they wish during the week at a constant wage of $4 per hour. There...
Suppose you have 24 hours per day that you can allocate between leisure and working (i)...
Suppose you have 24 hours per day that you can allocate between leisure and working (i) Draw the budget constraint between “leisure hours” on the horizontal axis and “wage income” on the vertical when the wage rate is $40 per hour. Mark an optimum point A that is meaningful. Draw a new budget constraint when the wage rate falls to $30 per hour. Show a new optimum point B. (ii) On your indifference curve diagram, decompose the effect of the...
INCOME (Dollars) Kate has 80 hours per week to devote to working or to leisure. She...
 INCOME (Dollars) Kate has 80 hours per week to devote to working or to leisure. She is paid an hourly wage and can work at her job as many hours a week as she likes. The following graph illustrates Kate's weekly income-lelsure tradeoff. The three lines labeled BC, BC, and BC illustrate her time allocation budget at three different wages; points A, B, and C show her optimal time allocation choices along each of these constralints BC 1200 BC 800...
10 10. The above diagram illustrates an indifference curve and two b udget lines for the...
 10
10.
The above diagram illustrates an indifference curve and two
b
udget lines for the same
worker. The thick line
is with a Universal Basic Income (UBI) p
rogram, while the thin
line is without such a program. (The two lines coincide for
con
sumption values above
$300.) The worker has 100 hours per week to allocate between
wo
rk and leisure, and faces
the market wage of $10 per hour. Without the program, the
worke
r chooses 38...
10
10.
The above diagram illustrates an indifference curve and two
b
udget lines for the same
worker. The thick line
is with a Universal Basic Income (UBI) p
rogram, while the thin
line is without such a program. (The two lines coincide for
con
sumption values above
$300.) The worker has 100 hours per week to allocate between
wo
rk and leisure, and faces
the market wage of $10 per hour. Without the program, the
worke
r chooses 38...
Draw the budget constraint between “leisure hours” on the horizontal axis and “wage income” on the...
Draw the budget constraint between “leisure hours” on the horizontal axis and “wage income” on the vertical when the wage rate is $40 per hour. Mark an optimum point A that is meaningful. Draw a new budget constraint when the wage rate falls to $30 per hour. Show a new optimum point B. On your indifference curve diagram, decompose the effect of the wage decrease into a “substitution effect” and an “income effect” (What is the direction of the substitution...
(Problem 1d). Leandro has 16 hours per day that he can allocate to work or leisure....
(Problem 1d). Leandro has 16 hours per day that he can allocate to work or leisure. His job pays a wage rate of $20. Leandro decides to consume 8 hours of leisure. His indifference curves have the usual shape: they slope downward, they do not cross, and they have the characteristic convex shape. Draw Leandro's time allocation budget line for a typical day, with income on the vertical axis and hours of leisure on the horizontal axis. Leandro's decision to...
 Pat's wage rate is $6 per hour and she has a maximum of 100 hours per week to allocate between leisure and work. Without any welfare assistance program, Pat chooses to work 37.5 hours per week. a. Suppose Pat is eligible for welfare benefits of $225 per week, but benefits are reduced $1 for every $1 she earns. Draw the budget line (label all relevant values) and indifference curve that represents Pat's maximum utility under these circumstances. b. The structure...
 1. Jack earns $20 per hour and he gets an allowance of $100 per week. He has 168 hours per week to spend on work and leisure. The price of consumption goods is normalized to $1. a. Draw Jack's budget line. (Label axis, give numbers for intercepts; indicate the magnitude of slope) (10 pts) b. If Jack could earn $30 per hour, how the budget line change? Show the new budget line in the graph from a). (Label axis, give...
 A person chooses between leisure and consumption. All of their consumption comes from current income. The utility derived from any combination of leisure and consumption is given by U- YL-88Y where U is utility, L is the hours of leisure per week and Yis the number of dollars of income all of which will be spent on consumption. The person can work as many hours as they wish during the week at a constant wage of $4 per hour. There...
 INCOME (Dollars) Kate has 80 hours per week to devote to working or to leisure. She is paid an hourly wage and can work at her job as many hours a week as she likes. The following graph illustrates Kate's weekly income-lelsure tradeoff. The three lines labeled BC, BC, and BC illustrate her time allocation budget at three different wages; points A, B, and C show her optimal time allocation choices along each of these constralints BC 1200 BC 800...
 10
10.
The above diagram illustrates an indifference curve and two
b
udget lines for the same
worker. The thick line
is with a Universal Basic Income (UBI) p
rogram, while the thin
line is without such a program. (The two lines coincide for
con
sumption values above
$300.) The worker has 100 hours per week to allocate between
wo
rk and leisure, and faces
the market wage of $10 per hour. Without the program, the
worke
r chooses 38...
10
10.
The above diagram illustrates an indifference curve and two
b
udget lines for the same
worker. The thick line
is with a Universal Basic Income (UBI) p
rogram, while the thin
line is without such a program. (The two lines coincide for
con
sumption values above
$300.) The worker has 100 hours per week to allocate between
wo
rk and leisure, and faces
the market wage of $10 per hour. Without the program, the
worke
r chooses 38...
Most questions answered within 3 hours.
-
Where is the error in this code sequence?
String s1 = "Hello";
String s2 = "ello";...
asked 11 months ago -
Financial data for Joel de Paris, Inc., for last year
follow:
Joel de Paris, Inc.
Balance...
asked 11 months ago -
Consider this reaction:
Al2(SO4)3 (aq)+ BaCl3
(aq) Al2Cl6 (aq)- +
3BaSO4(s) . What is the...
asked 11 months ago -
Suppose that Savneet is considering increasing her
recent random sample from 20 car rentals to 40...
asked 11 months ago -
Trucks arrive at an unloading terminal at an average rate of 120
per hour.
Trucks arrive...
asked 11 months ago -
Why are methanol and ethanol completely soluble in water while
octanol is not very little soluble....
asked 11 months ago -
A facilities manager at a university reads in a research report
that the mean amount of...
asked 11 months ago -
When the CuSO4 is rehydrated by adding water to the anhydrous
compound, is this an endothermic...
asked 11 months ago -
A ray of sunlight is passing from diamond into crown glass; the
angle of incidence is...
asked 11 months ago -
A block of mass 0.249 kg is placed on top of a light, vertical
spring of...
asked 11 months ago -
how do the kidneys compensate in the presences of acidosis
a) trigger hyperventilate
b) reserve acid...
asked 11 months ago -
Question 501 pts
The rental rate of capital to the firm increases. Which of the
following...
asked 11 months ago