Can somebody help me with my matlab code? I am plotting the POWER SPECTRAL DENSITY OF...
Can somebody help me with my matlab code? I am plotting the POWER SPECTRAL DENSITY OF Manchester, Polar, UNIPOLAR, and BIPOLAR.
It wont run. The error I am getting is "incorrect
dimensions for matrix multiplication. Check that the number
of columns in the first matrix matches the number of rows in
the
second matrix. To perform element wise multiplication, use '.*'.
"
clc;
clear all;
%Declaration of variables
bandwidth = 1;
total_bandwidth = 1/bandwidth;
f = 0:.05*bandwidth:2*total_bandwidth;
x=f*total_bandwidth;
%Manchester
Power =
total_bandwidth*(sin(x/2).*exp(2)*(sin(pi*x/2))*exp(2))
figure(1)
plot(f,Power,'r');
xlabel('Frequency');
title('PSD for Manchester Signal')
ylabel('Power Spectral Density')
%Uni-Polar Signal
P1 = .5*total_bandwidth*(sinc(x).*sinc(x))+.5*dirac(f);
figure(2)
plot(f,P1,'o');
xlabel('Frequency');
ylabel('Power Spectral Density');
title('PSD of Unipolar Signal');
%Polar Signal
P=total_bandwidth*sinc(x)
figure(3)
plot(f,P,'g')
grid on
box on
xlabel('Frequency')
ylabel('Power Spectral Densitiy')
title('PSD for Polar Signal')
%PSD of Bipolar Signal
P2 = total_bandwidth*(sinc(x/2).exp(2)*(sin(pi*x)))
hold on
figure(4)
plot(f,P2,'b');
xlabel('Frequency')
ylabel('Power Spectral Density')
title('PSD of Bipolar Signal')
Homework Answers
I have corrected all the syntax error in the code. I haven't gone through the whole code for different coding schemes as I have least knowledge about them and their PSD
Thank You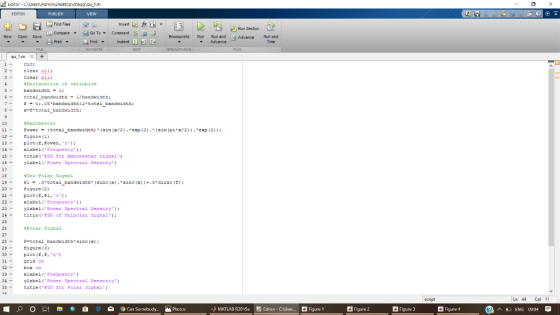


 .
.
Thank you
Add Answer to:
Can somebody help me with my matlab code? I am plotting
the POWER SPECTRAL DENSITY OF...
Reproduce Figures 9.2b and 9.2c on MATLAB, assuming that the square wave (Figure 9.2b) is a...
 Reproduce Figures 9.2b and 9.2c on MATLAB, assuming that the
square wave (Figure 9.2b) is a periodic symmetric square wave of
normalized amplitude (A=1). Each student group should
decide the power spectral density level of the channel noise.
Compute the Fourier transform of the periodic square wave.
clear all
close all
%%%%
T=12*pi; %number of period
x=linspace(0,T);
t=x/pi
y0=square(x); %square wave signal
y0ft=fft(y0); %calculating Fourier Transformof signal
y0fts=fftshift(y0ft);
y0ftFinal=abs(y0ft);
AWGN= rand(size(x)); %Calculating whit noise
Att=(1/3);
nSig= Att*AWGN;
y=y0+nSig; %Square wave...
Reproduce Figures 9.2b and 9.2c on MATLAB, assuming that the
square wave (Figure 9.2b) is a periodic symmetric square wave of
normalized amplitude (A=1). Each student group should
decide the power spectral density level of the channel noise.
Compute the Fourier transform of the periodic square wave.
clear all
close all
%%%%
T=12*pi; %number of period
x=linspace(0,T);
t=x/pi
y0=square(x); %square wave signal
y0ft=fft(y0); %calculating Fourier Transformof signal
y0fts=fftshift(y0ft);
y0ftFinal=abs(y0ft);
AWGN= rand(size(x)); %Calculating whit noise
Att=(1/3);
nSig= Att*AWGN;
y=y0+nSig; %Square wave...
Need help converting the following code from Matlab into Python: N=2048; fs=4.9; t=0:1/fs:(N-1)/fs; fs1=200; t1=0:1/fs1:(N-1)/fs1; x2=0.5+0.6366.*cos(2.*pi.*t1)+0.1273.*cos(10.*pi.*t1)-0.0909.*cos(14.*pi.*t1);...
Need help converting the following code from Matlab into Python: N=2048; fs=4.9; t=0:1/fs:(N-1)/fs; fs1=200; t1=0:1/fs1:(N-1)/fs1; x2=0.5+0.6366.*cos(2.*pi.*t1)+0.1273.*cos(10.*pi.*t1)-0.0909.*cos(14.*pi.*t1); x=0.5+0.6366.*cos(2.*pi.*t)+0.1273.*cos(10.*pi.*t)-0.0909.*cos(14.*pi.*t); X=fftshift(fft(x)); f=linspace(-fs/2,fs/2,N); plot(f,abs(X)./N); xlabel('f'); ylabel('|F(f)|'); title('magnitude spectrum of sampled signal'); x1=ifft(fftshift(X)); figure plot(t(1:100),x1(1:100)); xlabel('t'); ylabel('f(t)'); title('f(t) obtained by inverse transform'); figure plot(t1(1:1000),x2(1:1000)); xlabel('t'); ylabel('f(t)'); title('original f(t)');
Q.2 ICO2]10 Marks] The signal g(t) forms the input to the LPF circuit shown in the figure, where R l,and y(Dis the output. If the power spectral density (PSD) of the signal ge) is (a) The autoc...
 Q.2 ICO2]10 Marks] The signal g(t) forms the input to the LPF circuit shown in the figure, where R l,and y(Dis the output. If the power spectral density (PSD) of the signal ge) is (a) The autocorrelation of g(t) (b) The 3-dB bandwidth of the LPF (c) The power of g(t) and y(t) (d) Based on your answers above, will it be better if the signal has more or less bandwith? (e) If a white noise of PSD No/2 is...
I wrote a Matlab program for the figure below. When I plot the waves, they look...
I wrote a Matlab program for the figure below. When I plot the waves, they look the same. Why do the two waves frequencies look same and How do I avoid it? (I really do need this part of the question answered.) N = 200; % Total number of time domain samples in simulation. Fs = 100 ;% sampling frequency. F1 = 10; % frequency of wave - 1. F2 = 90; % frequency of wave - 2. phi =...
how to do laplace transform on a signal that is in frequency domain. I have a...
how to do laplace transform on a signal that is in frequency domain. I have a signal that is in time domain and i used fft to plot it in the frequency domain, is there a way i could plot it in s domain. I know that i could do laplace transform directly from time domain to s domain, but I need to find out are these two results match each other. Fs = 4; % samples per second dt...
Consider additive white Gaussian noise with a double-sided noise power spectral density (PSD) 12-90 dBm/Hz 1E-12 W/Hz....
 Consider additive white Gaussian noise with a double-sided noise power spectral density (PSD) 12-90 dBm/Hz 1E-12 W/Hz. This noise corrupts a baseband polar NRZ signal with rectangular pulses, like that 1 mV and the pulse duration is Tb such that the symbol rate is Rb 1/Tb. Since this is binary signaling, the symbol rate equals the bit rate of the incoming baseband pulse train: B Rt. The signal is then sampled at the center of the noisy shown in the...
Project in matlab. I have the correct ak value but not the correct ao value. My code is attached ...
 Project in matlab. I have the correct ak value but not the
correct ao value. My code is attached below also
2. Determine and plot the magnitude and phase spectrum of the Fourier series coefficients a, that is, plot ja, I as a function of discrete frequencies Jok and La, as a function of discrete frequencies fok 03 025 蓋0.2 0.15 0.1 o o5 ·10-8-6 4610 phase -2 -2 8- t= 0: .01:4; 9- to = 4; 10- fo =1/4;...
Project in matlab. I have the correct ak value but not the
correct ao value. My code is attached below also
2. Determine and plot the magnitude and phase spectrum of the Fourier series coefficients a, that is, plot ja, I as a function of discrete frequencies Jok and La, as a function of discrete frequencies fok 03 025 蓋0.2 0.15 0.1 o o5 ·10-8-6 4610 phase -2 -2 8- t= 0: .01:4; 9- to = 4; 10- fo =1/4;...
Program from problem 1: (Using MATLAB) % Sampling frequency and sampling period fs = 10000; ts...
 Program from problem 1: (Using MATLAB)
% Sampling frequency and sampling period
fs = 10000;
ts = 1/fs;
% Number of samples, assume 1000 samples
l = 1000;
t = 0:1:l-1;
t = t.*ts; % Convert the sample index into time for generation and
plotting of signal
% Frequency and amplitude of the sensor
f1 = 110;
a1 = 1.0;
% Frequency and amplitude of the power grid noise
f2 = 60;
a2 = 0.7;
% Generating the sinusoidal waves...
Program from problem 1: (Using MATLAB)
% Sampling frequency and sampling period
fs = 10000;
ts = 1/fs;
% Number of samples, assume 1000 samples
l = 1000;
t = 0:1:l-1;
t = t.*ts; % Convert the sample index into time for generation and
plotting of signal
% Frequency and amplitude of the sensor
f1 = 110;
a1 = 1.0;
% Frequency and amplitude of the power grid noise
f2 = 60;
a2 = 0.7;
% Generating the sinusoidal waves...
please help me with this MATLAB CODE and explain to me what each line does and...
 please help me with this MATLAB CODE and
explain to me what each line does and what is used for?
leave your comments as words, not as pictures.
.....................................................................................................................................................................
clear all; close all; % For a script file, you better start with
clear all and close all
% However, for a fucntion, you better NOT to start
% with them
%% End of cell mode example
%% Plot function
t = 0:0.1:5;
x1 = sin(2*5*t); x2 = cos(3*7*t);...
please help me with this MATLAB CODE and
explain to me what each line does and what is used for?
leave your comments as words, not as pictures.
.....................................................................................................................................................................
clear all; close all; % For a script file, you better start with
clear all and close all
% However, for a fucntion, you better NOT to start
% with them
%% End of cell mode example
%% Plot function
t = 0:0.1:5;
x1 = sin(2*5*t); x2 = cos(3*7*t);...
MATLAB code for a double pendulum. Please explain each lines for these codes pls. -------------------------------------...
MATLAB code for a double pendulum. Please explain each lines for these codes pls. ---------------------------------------------------------------------------- clc close all clear all %---------Parameters------------------------------------------------------ L1=1; L2=1 ; M_1=2 ; M_2=1; G=9.8; %---------initial condition----------------------------------------------- tspan=30; theta1=3; theta1_prime=0; theta2=2.5; theta2_prime=0; y0=[theta1 theta1_prime theta2 theta2_prime]; [t,y]=ode45(@pend, [0 ,tspan],[ 3 0 2 0]); %---position of mass 1 and mass 2---------------------------------------- x1=L1*sin(y(:,1)); y1=-L1*cos(y(:,1)); x2=L1*sin(y(:,1))+l2*sin(y(:,3)); y2=-L1*cos(y(:,1))-l2*cos(y(:,3)); %------visualizing the result--------------------------------------------- figure(1) plot(x1,y1,'linewidth',2) hold on plot(x2,y2,'r','linewidth',2) h=gca; get(h,'fontSize') set(h,'fontSize',14) xlabel('X','fontSize',14); ylabel('Y','fontSize',14); title('Chaotic Double Pendulum','fontsize',14) fh = figure(1); set(fh, 'color', 'white'); figure(2)...
 Reproduce Figures 9.2b and 9.2c on MATLAB, assuming that the
square wave (Figure 9.2b) is a periodic symmetric square wave of
normalized amplitude (A=1). Each student group should
decide the power spectral density level of the channel noise.
Compute the Fourier transform of the periodic square wave.
clear all
close all
%%%%
T=12*pi; %number of period
x=linspace(0,T);
t=x/pi
y0=square(x); %square wave signal
y0ft=fft(y0); %calculating Fourier Transformof signal
y0fts=fftshift(y0ft);
y0ftFinal=abs(y0ft);
AWGN= rand(size(x)); %Calculating whit noise
Att=(1/3);
nSig= Att*AWGN;
y=y0+nSig; %Square wave...
Reproduce Figures 9.2b and 9.2c on MATLAB, assuming that the
square wave (Figure 9.2b) is a periodic symmetric square wave of
normalized amplitude (A=1). Each student group should
decide the power spectral density level of the channel noise.
Compute the Fourier transform of the periodic square wave.
clear all
close all
%%%%
T=12*pi; %number of period
x=linspace(0,T);
t=x/pi
y0=square(x); %square wave signal
y0ft=fft(y0); %calculating Fourier Transformof signal
y0fts=fftshift(y0ft);
y0ftFinal=abs(y0ft);
AWGN= rand(size(x)); %Calculating whit noise
Att=(1/3);
nSig= Att*AWGN;
y=y0+nSig; %Square wave...
 Q.2 ICO2]10 Marks] The signal g(t) forms the input to the LPF circuit shown in the figure, where R l,and y(Dis the output. If the power spectral density (PSD) of the signal ge) is (a) The autocorrelation of g(t) (b) The 3-dB bandwidth of the LPF (c) The power of g(t) and y(t) (d) Based on your answers above, will it be better if the signal has more or less bandwith? (e) If a white noise of PSD No/2 is...
 Consider additive white Gaussian noise with a double-sided noise power spectral density (PSD) 12-90 dBm/Hz 1E-12 W/Hz. This noise corrupts a baseband polar NRZ signal with rectangular pulses, like that 1 mV and the pulse duration is Tb such that the symbol rate is Rb 1/Tb. Since this is binary signaling, the symbol rate equals the bit rate of the incoming baseband pulse train: B Rt. The signal is then sampled at the center of the noisy shown in the...
 Project in matlab. I have the correct ak value but not the
correct ao value. My code is attached below also
2. Determine and plot the magnitude and phase spectrum of the Fourier series coefficients a, that is, plot ja, I as a function of discrete frequencies Jok and La, as a function of discrete frequencies fok 03 025 蓋0.2 0.15 0.1 o o5 ·10-8-6 4610 phase -2 -2 8- t= 0: .01:4; 9- to = 4; 10- fo =1/4;...
Project in matlab. I have the correct ak value but not the
correct ao value. My code is attached below also
2. Determine and plot the magnitude and phase spectrum of the Fourier series coefficients a, that is, plot ja, I as a function of discrete frequencies Jok and La, as a function of discrete frequencies fok 03 025 蓋0.2 0.15 0.1 o o5 ·10-8-6 4610 phase -2 -2 8- t= 0: .01:4; 9- to = 4; 10- fo =1/4;...
 Program from problem 1: (Using MATLAB)
% Sampling frequency and sampling period
fs = 10000;
ts = 1/fs;
% Number of samples, assume 1000 samples
l = 1000;
t = 0:1:l-1;
t = t.*ts; % Convert the sample index into time for generation and
plotting of signal
% Frequency and amplitude of the sensor
f1 = 110;
a1 = 1.0;
% Frequency and amplitude of the power grid noise
f2 = 60;
a2 = 0.7;
% Generating the sinusoidal waves...
Program from problem 1: (Using MATLAB)
% Sampling frequency and sampling period
fs = 10000;
ts = 1/fs;
% Number of samples, assume 1000 samples
l = 1000;
t = 0:1:l-1;
t = t.*ts; % Convert the sample index into time for generation and
plotting of signal
% Frequency and amplitude of the sensor
f1 = 110;
a1 = 1.0;
% Frequency and amplitude of the power grid noise
f2 = 60;
a2 = 0.7;
% Generating the sinusoidal waves...
 please help me with this MATLAB CODE and
explain to me what each line does and what is used for?
leave your comments as words, not as pictures.
.....................................................................................................................................................................
clear all; close all; % For a script file, you better start with
clear all and close all
% However, for a fucntion, you better NOT to start
% with them
%% End of cell mode example
%% Plot function
t = 0:0.1:5;
x1 = sin(2*5*t); x2 = cos(3*7*t);...
please help me with this MATLAB CODE and
explain to me what each line does and what is used for?
leave your comments as words, not as pictures.
.....................................................................................................................................................................
clear all; close all; % For a script file, you better start with
clear all and close all
% However, for a fucntion, you better NOT to start
% with them
%% End of cell mode example
%% Plot function
t = 0:0.1:5;
x1 = sin(2*5*t); x2 = cos(3*7*t);...
Most questions answered within 3 hours.
-
Where is the error in this code sequence?
String s1 = "Hello";
String s2 = "ello";...
asked 10 months ago -
Financial data for Joel de Paris, Inc., for last year
follow:
Joel de Paris, Inc.
Balance...
asked 10 months ago -
Consider this reaction:
Al2(SO4)3 (aq)+ BaCl3
(aq) Al2Cl6 (aq)- +
3BaSO4(s) . What is the...
asked 10 months ago -
Suppose that Savneet is considering increasing her
recent random sample from 20 car rentals to 40...
asked 10 months ago -
Trucks arrive at an unloading terminal at an average rate of 120
per hour.
Trucks arrive...
asked 10 months ago -
Why are methanol and ethanol completely soluble in water while
octanol is not very little soluble....
asked 10 months ago -
A facilities manager at a university reads in a research report
that the mean amount of...
asked 10 months ago -
When the CuSO4 is rehydrated by adding water to the anhydrous
compound, is this an endothermic...
asked 10 months ago -
A ray of sunlight is passing from diamond into crown glass; the
angle of incidence is...
asked 10 months ago -
A block of mass 0.249 kg is placed on top of a light, vertical
spring of...
asked 10 months ago -
how do the kidneys compensate in the presences of acidosis
a) trigger hyperventilate
b) reserve acid...
asked 10 months ago -
Question 501 pts
The rental rate of capital to the firm increases. Which of the
following...
asked 10 months ago