A population of 9,000 men was examined in January 2014. Of these men, 6,000 were exposed...
A population of 9,000 men was examined in January 2014. Of these men, 6,000 were exposed to high levels of air pollution, and 3,000 were exposed to low levels of air pollution. At the physical examination, 90 cases of chronic bronchitis were identified, including 60 cases among the high-exposure group.
Calculate the prevalence:
| Cases | Population | Prevalence | |
| High exposure group | |||
| Low exposure group | |||
| Total group |
All of the men who were initially examined and did not have chronic bronchitis were followed by repeat examination over the next five years. These follow-up exams identified 268 new cases of bronchitis in the total group, including 30 cases among the low-exposure group.
Calculate the incidence:
| Cases | Population | Incidence | |
| High Exposure Group | |||
| Low Exposure Group | |||
| Total Group |
What can be said about the risk of chronic bronchitis over time based on the incidence and prevalence calculations?
Homework Answers
Firstly definition of
PREVELANCE - refers to number of cases of a disease that are present in a particular population at a given time . It is often confused with incidence .
INCIDENCE- is the rate of newly diagnosed cases in a population.
In the above example one can say that risk of chronic bronchitis
depends upon the exposure as the PREVELANCE of bronchitis in high
exposure group is more than low exposure group . But over the time
when after 5 years results were calculated it again showed that
continued exposure also lead to bronchitis in low exposure patients
also . 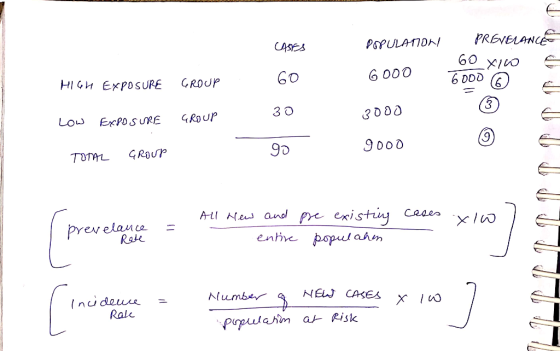
Add Answer to:
A population of 9,000 men was examined in January 2014. Of these
men, 6,000 were exposed...
A population of 9000 men and women, aged 45, were examined on January 1st, 2005. Of...
A population of 9000 men and women, aged 45, were examined on January 1st, 2005. Of these people, 6,000 were exposed to toxins in the local water supply and 3,000 were not. At the time of this exam, 90 cases of peptic ulcer diseases were discovered. 60 of these cases were among those exposed to toxins in their local water. all the people at the initial exam who were free from peptic ulcer disease were followed with repeat exams over...
U lilly WII Peceive a score of 0. Question 9 4 pts You conducted a study...
 U lilly WII Peceive a score of 0. Question 9 4 pts You conducted a study on the possible effects of air pollution on the development of chronic bronchitis. You examined a population of 9,000 men aged 45 years in January 2009. Of these, 6,000 lived in areas where they were exposed to air pollution and 3,000 did not. At this examination, 90 cases of chronic bronchitis were discovered, 60 among those exposed to air pollution. All the men initially...
Among a total of 1000 college freshmen, a total of 450 have consumed energy drinks and...
Among a total of 1000 college freshmen, a total of 450 have consumed energy drinks and 375 have used alcohol. Of those who . consumed energy drinks, 305 have used alcohol 1. Using energy drink consumption as the exposure and alcohol use as the "disease," create a contingency table with the data (1 points) 2. In order to determine internal validity of the study, what information (at least two things) would you want/need to know? Why is each important for...
If D equals the number of deaths in 2009 and P equals the population at the...
If D equals the number of deaths in 2009 and P equals the population at the midpoint of 2009 and A equals the number of persons aged 15-24, then the crude death rate per 100,000 population would be: A. (D/P) × 100,000 B. (A/P) × 100,000 C. (P/D) × 100,000 D. (P/A) X 100,000 The number of deaths due to a disease that occurs among persons who are afflicted with the condition is known as: A. Crude death rate B. ...
2.94 points QUESTION 11 This measure shows how the observed mortality in a population compares...
2.94 points QUESTION 11 This measure shows how the observed mortality in a population compares to expectations: age-specific rate cause-specific rate proportional mortality ratio standardized mortality ratio 2.94 points QUESTION 12 33% of deaths among 44-65 years olds were due to drug overdose is an example of a: age-specific rate cause-specific rate proportional mortality ratio standardized mortality ratio 2.94 points QUESTION 13 In 2017, there were 300 deaths per 100,000 people aged 25-34 years in Rhode Island....
During 2015–2016, 12.4% of adults had high total cholesterol and 18.4% had low HDL cholesterol. There...
During 2015–2016, 12.4% of adults had high total cholesterol and 18.4% had low HDL cholesterol. There were no significant race and Hispanic-origin differences in high total cholesterol overall or in men, but non-Hispanic white women had a higher prevalence of high total cholesterol than Hispanic women. The prevalence of low HDL cholesterol was lowest in non-Hispanic black adults and highest in Hispanic adults overall and for men, and the percentage with low HDL cholesterol was higher in Hispanic women than...
USE THE FOLLOWING INFORMAITON FOR QUESTIONS 13-16 Regionville is a community with a population of 100,000....
 USE THE FOLLOWING INFORMAITON FOR QUESTIONS 13-16 Regionville is a community with a population of 100,000. During 2018, there were 1,000 deaths from all causes in Regionville. A cross-sectional screening program in 2018 identified all existing cases of Hepatitis B in this community. A total of 300 cases were found, and included 200 males and 100 females. During the year 2018, six people died from Hepatitis B in Regionville. Five of the six people who died from Hep B were...
Signature Cou Questions 1-16 Questions 17-32 Questions 33-35 I point each. 2 points each. 4 points...
 Signature Cou Questions 1-16 Questions 17-32 Questions 33-35 I point each. 2 points each. 4 points each. For questions 1-29, select one answer and circle. Please do not write your answer in the margin. 1. Age-adjusted mortality rates are used to determine the number of deaths that occurred in specific age groups in a population b. correct mortality rates for missing age information c. eliminate the effects of differences in the age distributions of populations when comparing mortality rates d....
In your opinion, which of the below three study design is best to assess the relationship...
In your opinion, which of the below three study design is best to assess the relationship between smoking and CRC? Why? (6 sentences) No plagiarism please Cross Sectional Study 1. Verga Enterprises is conducting a study to assess the relationship between smoking and colorectal cancer (CRC). In the survey that was conducted, 20 out of 100 non-smokers had CRC, while 40 out of 60 smokers had CRC. (a) What makes this a Cross Sectional study design? This particular case is...
As a reader, let us assume that this information is relevant to you because of your...
As a reader, let us assume that this information is relevant to you because of your line of work: How would this document make more sense to you? What could make it easier to understand, or less copious for you to read? As a writer, what would you like your audience to know or to understand? Why should they care about this information and associated data? What can you do to avoid them becoming tired, bored, or uninterested in what...
 U lilly WII Peceive a score of 0. Question 9 4 pts You conducted a study on the possible effects of air pollution on the development of chronic bronchitis. You examined a population of 9,000 men aged 45 years in January 2009. Of these, 6,000 lived in areas where they were exposed to air pollution and 3,000 did not. At this examination, 90 cases of chronic bronchitis were discovered, 60 among those exposed to air pollution. All the men initially...
 USE THE FOLLOWING INFORMAITON FOR QUESTIONS 13-16 Regionville is a community with a population of 100,000. During 2018, there were 1,000 deaths from all causes in Regionville. A cross-sectional screening program in 2018 identified all existing cases of Hepatitis B in this community. A total of 300 cases were found, and included 200 males and 100 females. During the year 2018, six people died from Hepatitis B in Regionville. Five of the six people who died from Hep B were...
 Signature Cou Questions 1-16 Questions 17-32 Questions 33-35 I point each. 2 points each. 4 points each. For questions 1-29, select one answer and circle. Please do not write your answer in the margin. 1. Age-adjusted mortality rates are used to determine the number of deaths that occurred in specific age groups in a population b. correct mortality rates for missing age information c. eliminate the effects of differences in the age distributions of populations when comparing mortality rates d....
Most questions answered within 3 hours.
-
Where is the error in this code sequence?
String s1 = "Hello";
String s2 = "ello";...
asked 11 months ago -
Financial data for Joel de Paris, Inc., for last year
follow:
Joel de Paris, Inc.
Balance...
asked 11 months ago -
Consider this reaction:
Al2(SO4)3 (aq)+ BaCl3
(aq) Al2Cl6 (aq)- +
3BaSO4(s) . What is the...
asked 11 months ago -
Suppose that Savneet is considering increasing her
recent random sample from 20 car rentals to 40...
asked 11 months ago -
Trucks arrive at an unloading terminal at an average rate of 120
per hour.
Trucks arrive...
asked 11 months ago -
Why are methanol and ethanol completely soluble in water while
octanol is not very little soluble....
asked 11 months ago -
A facilities manager at a university reads in a research report
that the mean amount of...
asked 11 months ago -
When the CuSO4 is rehydrated by adding water to the anhydrous
compound, is this an endothermic...
asked 11 months ago -
A ray of sunlight is passing from diamond into crown glass; the
angle of incidence is...
asked 11 months ago -
A block of mass 0.249 kg is placed on top of a light, vertical
spring of...
asked 11 months ago -
how do the kidneys compensate in the presences of acidosis
a) trigger hyperventilate
b) reserve acid...
asked 11 months ago -
Question 501 pts
The rental rate of capital to the firm increases. Which of the
following...
asked 11 months ago