Write the codes and plot the graphs of the following sine waves in Matlab: a. Sin(2πft)...
Write the codes and plot the graphs of the following sine waves in Matlab:
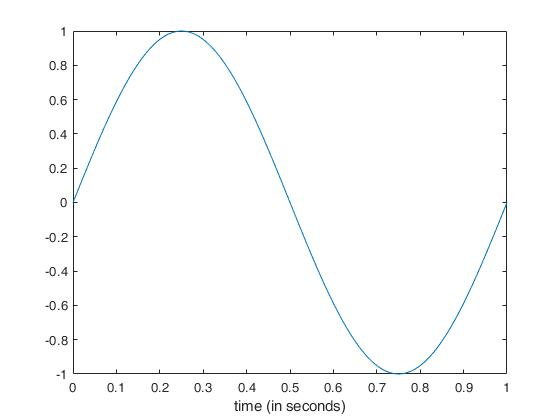
a. Sin(2πft)
b. 1/3Sin(2π(3f)t)
c. 4/π[Sin(2πft) + 1/3Sin(2π(3f)t]
d. 4[Sin(2πft) + 1/3Sin(2π(3f)t]
Homework Answers
%a)Sin(2pift)
%Initialize Time and Frequency
t = 0:0.01:1;
f = 1;
%Sine Function
x1 = sin(2*pi()*f*t);
%Plot
plot(t,x1);
xlabel('time (in seconds)');
%b)1/3 Sin(2pi(3f)t)
%Initialize Time and Frequency
t = 0:0.01:1;
f = 2;
%Sine Function
x2 = (1/3)*sin(2*pi()*3*f*t);
%Plot
plot(t,x2);
xlabel('time (in seconds)');

%c)4/π[Sin(2pift) + 1/3Sin(2pi(3f)t]
%Initialize Time and Frequency
t = 0:0.01:1;
f = 2;
%Sine Function
x3 = (4/pi()) * (sin(2*pi()*f*t) + (1/3)*sin(2*pi()*3*f*t));
%Plot
plot(t,x3);
xlabel('time (in seconds)');

%d)4[Sin(2pift) + 1/3Sin(2pi(3f)t]
%Initialize Time and Frequency
t = 0:0.01:1;
f = 2;
%Sine Function
x4 = (4) * (sin(2*pi()*f*t) + (1/3)*sin(2*pi()*3*f*t));
%Plot
plot(t,x4);
xlabel('time (in seconds)');

Add Answer to:
Write the codes and plot the graphs of the following sine waves
in Matlab:
a. Sin(2πft)...
Please answer this question using Matlab: Write a matlab function to generate and plot a sine...
Please answer this question using Matlab: Write a matlab function to generate and plot a sine wave at a specified frequency having at least 10 cycles, for this case the amplitude will represent voltage. Your sine wave should have a positive going zero crossing at T=0. Make sure your plot has at least 25 samples per cycle. Make sure the plot is with respect to time. Your function needs to return your generated samples and time vector. The frequency will...
The following equation describes a wave due to the interference of two waves with the same...
The following equation describes a wave due to the interference of two waves with the same amplitude and wave number, but offset by a phase difference ϕ. D(x,t)=2A cos(ϕ/2)sin(kx−ωt+ϕ/2) What is the phase difference if the amplitude of the resultant wave is A? A. π/6 B. π/4 C. π/3 D. π/2 E. 2π/3 F. π G. 2π
run III please write the codes and do exactly what they asked runIV plot by HAND...
 run III
please write the codes and do exactly what they asked
runIV
plot by HAND and use MATLAB also
-will get tumbs up
RUNWIN Use Matlab to solve the following non-linear equation: sin(w. ) - cos (w. ), for tan(w. ) sin(w. ) +12 for /2 RUNWIV I + + 2 Obtain plots by hand and by using Matlab of the following equation: (D) sin( +90°) vs. radians, degrees and time
run III
please write the codes and do exactly what they asked
runIV
plot by HAND and use MATLAB also
-will get tumbs up
RUNWIN Use Matlab to solve the following non-linear equation: sin(w. ) - cos (w. ), for tan(w. ) sin(w. ) +12 for /2 RUNWIV I + + 2 Obtain plots by hand and by using Matlab of the following equation: (D) sin( +90°) vs. radians, degrees and time
Using Matlab. I need the matlab code for: a. Plot a 1 Hz sine wave b....
Using Matlab. I need the matlab code for: a. Plot a 1 Hz sine wave b. Plot the unit rectangle function. c. Plot the unit triangle function Show each over a plotting interval -5 sec to 5 sec.
Write as a MatLab function P5: For X=0 ~ 2π with intervals of π/100 use the...
Write as a MatLab function P5: For X=0 ~ 2π with intervals of π/100 use the following equations Y4=sin(X), Y5=sin(X-0.25), Y6=sin (X-1.5), Y7=sin(X-0.85), Y8=sin(X)sin(X+0.75) a. Plot Y4, Y5 and Y6 in the same plot. Add title, labels, legend. Plot them with different colors and line styles b. Plot Y4, Y5, Y6 and Y7 as subplots. Add title, labels. Plot them with different colors and line styles c. Plot Y4 and Y8 in the same plot using the hold on/off. Add...
Sign In d share 1. Plot the points (r, θ)-(3, π), ( 2år) , (1, π/4) and find the Eport PDA Create FDF Edit PDF rectangular (Cartesian) coordinates of the ponts without using a ca culator 2. Plot the...
 Sign In d share 1. Plot the points (r, θ)-(3, π), ( 2år) , (1, π/4) and find the Eport PDA Create FDF Edit PDF rectangular (Cartesian) coordinates of the ponts without using a ca culator 2. Plot the point with rectangular coordinates (z, y)- and find the polar coordinates (r,0) for the point with r > 0 and 0 < θ < 2π without using a calculator. Then, find two other ways to write the point in polar coordinates....
Consider the continuous time signal: 2. , π (sin (2t) (Sin (8t) A discrete time signal x[n] -xs(t) -x(nTs) is created by sampling x() with sampling interval, 2it 60 a) Plot the Fourier Transform of t...
 Consider the continuous time signal: 2. , π (sin (2t) (Sin (8t) A discrete time signal x[n] -xs(t) -x(nTs) is created by sampling x() with sampling interval, 2it 60 a) Plot the Fourier Transform of the sampled signal, i.e. Xs (jo). b) Plot the DTFT of the sampled signal, ie, X(eja) o) Repeat (a) with 7, 2π d) Repeat (b) with , 18
Consider the continuous time signal: 2. , π (sin (2t) (Sin (8t) A discrete time signal x[n]...
Consider the continuous time signal: 2. , π (sin (2t) (Sin (8t) A discrete time signal x[n] -xs(t) -x(nTs) is created by sampling x() with sampling interval, 2it 60 a) Plot the Fourier Transform of the sampled signal, i.e. Xs (jo). b) Plot the DTFT of the sampled signal, ie, X(eja) o) Repeat (a) with 7, 2π d) Repeat (b) with , 18
Consider the continuous time signal: 2. , π (sin (2t) (Sin (8t) A discrete time signal x[n]...
Use Matlab and please explain how you got the answers. Write the exact codes. 4. (12...
 Use Matlab and please explain how you got the answers. Write the
exact codes.
4. (12 points) Derad2deg(C) (all values in D are in degree) a. Determine sin(D), cos(D), tan(D) b. Determine sin(D)+cos (D) [hints: sin(D).A2+cos(D).2] c. Determine sin (D), cos (D) and tan (D)
Use Matlab and please explain how you got the answers. Write the
exact codes.
4. (12 points) Derad2deg(C) (all values in D are in degree) a. Determine sin(D), cos(D), tan(D) b. Determine sin(D)+cos (D) [hints: sin(D).A2+cos(D).2] c. Determine sin (D), cos (D) and tan (D)
I wrote a Matlab program for the figure below. When I plot the waves, they look...
I wrote a Matlab program for the figure below. When I plot the waves, they look the same. Why do the two waves frequencies look same and How do I avoid it? (I really do need this part of the question answered.) N = 200; % Total number of time domain samples in simulation. Fs = 100 ;% sampling frequency. F1 = 10; % frequency of wave - 1. F2 = 90; % frequency of wave - 2. phi =...
(A.) Use MATLAB to generate a pulsed sine wave signal having a frequency F-10KHZ and a...
 (A.) Use MATLAB to generate a pulsed sine wave signal having a frequency F-10KHZ and a pulse width of T-.5ms. The pulse repetition time is 1ms (pulse repetition rate is 1000 pulses/sec), i.e., the signal is zero between pulses. Model the signal to start at time t-0 and to end at a time t=Tstop. Use a sample time of .001ms to approximate an analog environment. Display the signal in MATLAB appropriate for an analog signal, first for Tstop 1ms and...
 run III
please write the codes and do exactly what they asked
runIV
plot by HAND and use MATLAB also
-will get tumbs up
RUNWIN Use Matlab to solve the following non-linear equation: sin(w. ) - cos (w. ), for tan(w. ) sin(w. ) +12 for /2 RUNWIV I + + 2 Obtain plots by hand and by using Matlab of the following equation: (D) sin( +90°) vs. radians, degrees and time
run III
please write the codes and do exactly what they asked
runIV
plot by HAND and use MATLAB also
-will get tumbs up
RUNWIN Use Matlab to solve the following non-linear equation: sin(w. ) - cos (w. ), for tan(w. ) sin(w. ) +12 for /2 RUNWIV I + + 2 Obtain plots by hand and by using Matlab of the following equation: (D) sin( +90°) vs. radians, degrees and time
 Sign In d share 1. Plot the points (r, θ)-(3, π), ( 2år) , (1, π/4) and find the Eport PDA Create FDF Edit PDF rectangular (Cartesian) coordinates of the ponts without using a ca culator 2. Plot the point with rectangular coordinates (z, y)- and find the polar coordinates (r,0) for the point with r > 0 and 0 < θ < 2π without using a calculator. Then, find two other ways to write the point in polar coordinates....
 Consider the continuous time signal: 2. , π (sin (2t) (Sin (8t) A discrete time signal x[n] -xs(t) -x(nTs) is created by sampling x() with sampling interval, 2it 60 a) Plot the Fourier Transform of the sampled signal, i.e. Xs (jo). b) Plot the DTFT of the sampled signal, ie, X(eja) o) Repeat (a) with 7, 2π d) Repeat (b) with , 18
Consider the continuous time signal: 2. , π (sin (2t) (Sin (8t) A discrete time signal x[n]...
Consider the continuous time signal: 2. , π (sin (2t) (Sin (8t) A discrete time signal x[n] -xs(t) -x(nTs) is created by sampling x() with sampling interval, 2it 60 a) Plot the Fourier Transform of the sampled signal, i.e. Xs (jo). b) Plot the DTFT of the sampled signal, ie, X(eja) o) Repeat (a) with 7, 2π d) Repeat (b) with , 18
Consider the continuous time signal: 2. , π (sin (2t) (Sin (8t) A discrete time signal x[n]...
 Use Matlab and please explain how you got the answers. Write the
exact codes.
4. (12 points) Derad2deg(C) (all values in D are in degree) a. Determine sin(D), cos(D), tan(D) b. Determine sin(D)+cos (D) [hints: sin(D).A2+cos(D).2] c. Determine sin (D), cos (D) and tan (D)
Use Matlab and please explain how you got the answers. Write the
exact codes.
4. (12 points) Derad2deg(C) (all values in D are in degree) a. Determine sin(D), cos(D), tan(D) b. Determine sin(D)+cos (D) [hints: sin(D).A2+cos(D).2] c. Determine sin (D), cos (D) and tan (D)
 (A.) Use MATLAB to generate a pulsed sine wave signal having a frequency F-10KHZ and a pulse width of T-.5ms. The pulse repetition time is 1ms (pulse repetition rate is 1000 pulses/sec), i.e., the signal is zero between pulses. Model the signal to start at time t-0 and to end at a time t=Tstop. Use a sample time of .001ms to approximate an analog environment. Display the signal in MATLAB appropriate for an analog signal, first for Tstop 1ms and...
Most questions answered within 3 hours.
-
Where is the error in this code sequence?
String s1 = "Hello";
String s2 = "ello";...
asked 10 months ago -
Financial data for Joel de Paris, Inc., for last year
follow:
Joel de Paris, Inc.
Balance...
asked 10 months ago -
Consider this reaction:
Al2(SO4)3 (aq)+ BaCl3
(aq) Al2Cl6 (aq)- +
3BaSO4(s) . What is the...
asked 10 months ago -
Suppose that Savneet is considering increasing her
recent random sample from 20 car rentals to 40...
asked 10 months ago -
Trucks arrive at an unloading terminal at an average rate of 120
per hour.
Trucks arrive...
asked 10 months ago -
Why are methanol and ethanol completely soluble in water while
octanol is not very little soluble....
asked 10 months ago -
A facilities manager at a university reads in a research report
that the mean amount of...
asked 10 months ago -
When the CuSO4 is rehydrated by adding water to the anhydrous
compound, is this an endothermic...
asked 10 months ago -
A ray of sunlight is passing from diamond into crown glass; the
angle of incidence is...
asked 10 months ago -
A block of mass 0.249 kg is placed on top of a light, vertical
spring of...
asked 10 months ago -
how do the kidneys compensate in the presences of acidosis
a) trigger hyperventilate
b) reserve acid...
asked 10 months ago -
Question 501 pts
The rental rate of capital to the firm increases. Which of the
following...
asked 10 months ago