![The elevation profile for the above plot of land is [1, 2, 3, 1, 2,1,4, 8, 2, 2, 2, 0]. One can form the largest cross sectio](http://img.homeworklib.com/images/35eeb4f5-4449-4ac3-b5c3-28554da7bfec.png?x-oss-process=image/resize,w_560)

![Input: [0, 5, 3, 1, 2, 0, 4, 6, 9, 0, 0, 0] Max Area 7x5 35 units In the above example the terrain profile in 2D can be repre](http://img.homeworklib.com/images/15b9ec20-9240-4db9-9730-b2051806dbf9.png?x-oss-process=image/resize,w_560)
![Input: [1, 2, 3, 1, 2,1, 4, 8, 2, 2, 2, 0] Max Area 2x9 18 units The elevation profile for the above plot of land is [1, 2, 3](http://img.homeworklib.com/images/843e7c34-62b1-42c3-a79e-380bad6b6ac5.png?x-oss-process=image/resize,w_560)
![Examples: input: [22,31,1,23] output: 66 input: [1] output: O input: [1,3,5] output: 3 input: [3,2,1] output: 2 (see below gr](http://img.homeworklib.com/images/9e8f35bf-fe4e-44a9-987e-a58862c1e9cd.png?x-oss-process=image/resize,w_560)
![input: [3,2,1] output: 2 (see below graphical illustration either you take the orange box or red you end up with a max area o](http://img.homeworklib.com/images/ab7c5efb-f2b0-41ac-9c16-1bca5b0fec10.png?x-oss-process=image/resize,w_560)
![input: [1,99,1] output: 2 Constraints / Assumptions: . The terrain map is never NULL, namely arr.length is always > 0 . X axi](http://img.homeworklib.com/images/826b0dee-1139-4e17-86ae-70364e8d23ef.png?x-oss-process=image/resize,w_560)
(2) (10 Points) The State of California is interested in creating ways to retain precious rain water so it doesn't drain to ground or to the Pac Blue completely. The Department wants to arrive at metrics to help determine the best way to preserve rain water. One metric calls for excavating soil out of the ground to create "pockets" or retention ponds that can hold the most amount of rain water. No terrairn is flat so this task involves measuring elevation profile of the terrain. Generally a 2-D terrain can be represented by stakes (vertical bars) in the following graph: Input: [0, 5, 3, 1, 2, 0, 4, 6, 9, 0, 0, 0]
Input: [0, 5, 3, 1, 2, 0, 4, 6, 9, 0, 0, 0] Max Area 7x5 35 units In the above example the terrain profile in 2D can be represented by data inside an array of [0, 5, 3,1, 2, 0, 4, 6, 9, 0, 0, O]. Each square box is of 1x1 unit. The max amount of water retention occurs if we dig into ground 5 units
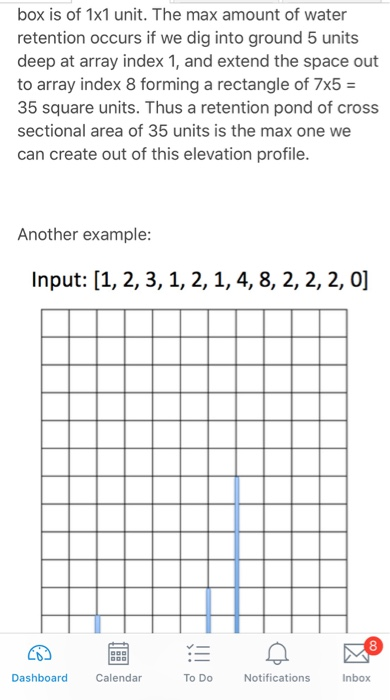
box is of 1x1 unit. The max amount of water retention occurs if we dig into ground 5 units deep at array index 1, and extend the space out to array index 8 forming a rectangle of 7x5- 35 square units. Thus a retention pond of cross sectional area of 35 units is the max one we can create out of this elevation profile. Another example: Input: [1, 2, 3, 1, 2,1, 4, 8, 2, 2, 2, 0] 8 To Do Notificat DashboardCalendar ions Inbox
Input: [1, 2, 3, 1, 2,1, 4, 8, 2, 2, 2, 0] Max Area 2x9 18 units The elevation profile for the above plot of land is [1, 2, 3, 1, 2, 1, 4, 8, 2, 2, 2, 0]. One can form the largest cross sectional area by excavating soil at array index 1 and extend that area all the way to array index 10 forming a rectangle of
Examples: input: [22,31,1,23] output: 66 input: [1] output: O input: [1,3,5] output: 3 input: [3,2,1] output: 2 (see below graphical illustration either you take the orange box or red you end up with a max area of 2)
input: [3,2,1] output: 2 (see below graphical illustration either you take the orange box or red you end up with a max area of 2) Array 3, 2,1) input: [1,1,1,1,1,1,,1,1 output: 8
input: [1,99,1] output: 2 Constraints / Assumptions: . The terrain map is never NULL, namely arr.length is always > 0 . X axis represents width (distance); the distance between two adjacent elevation (height) points is one unit . Y axis represents elevation (height) in the same unit as x-axis . The function returns 0 if there is not enough soil to create that cross sectional area (namely array containing just 1 unit width) (UPDATED) Input array (arr) is passed in by pointer into the function . You should submit a fully working console program however your main() function isn't graded; only the above referenced function is . It is your responsibility to compile your
same unit as x-axis The function returns 0 if there is not enough soil to create that cross sectional area (namely array containing just 1 unit width) (UPDATED) Input array (arr) is passed in by pointer into the function You should submit a fully working console program however your main() function isn't graded; only the above referenced function is . It is your responsibility to compile your code in C++11/C++14 (no pre-C++11!) Failure to do that means your code isn'1t compilable and you will receive 0 point . Wrong function signature receives -1 styling point Logic: 9 points (-1 point for each test case failure, -1 for incorrect function signature) Styling/Documentation: 1 point
Homework Answers
The problem is quite easy and can be solved in multiple ways. I will provide with a solution that works in O(N2) complexity where N = size of the given array. This solution is pretty straightforward. But there also exists a solution that works in O(N * log(N)) complexity, but this solution is quite cumbersome to code and requires the use of segment trees. However, if you still need that solution just let me know in the comments and I will help you out. So, I will explain how the simple solution works.
Let the array of heights be denoted by arr[size] and any current position be denoted by arr[i]. Let us fix a certain position arr[i] and from this position, we can dig the pond either to this right of this position or to the left of this position, that is, from arr[i] to arr[j] where (i + 1 <= j <= N - 1) or from arr[k] to arr[i] where (0 <= k <= i - 1). Notice that I have used 0 indexing. So once we have established the rules on how to dig the pond we need an algorithm that determines how to get the largest area of the pond. The algorithm is fairly simple just pay attention a little bit. Once we have fixed a particular position i and have a current height of arr[i], we need to find the largest j where (i + 1 <= j <= N - 1) such that arr[j] >= arr[i]. Once we have found such j, the area would be equal to (j - i) * arr[i], similarly find out the smallest k where (0 <= k <= i - 1) such that arr[k] >= arr[i]. Once we have found out such k, the area would be (i - k) * arr[i] and we take the maximum of these two areas as the current maximum area. We do this process for every single i and select the area with the highest value. The algorithm makes sense because when we are searching for the rightmost index j or the leftmost index k, we are ensuring that the required length of the rectangle is maximum provided the condition that the endpoint height that is either (arr[j] / arr[k] >= arr[i]). This solution works on the idea that if we want to increase the area of the required rectangle then the length and breadth should be increased but since the height of the rectangle is fixed (arr[i]), we can only increase the breadth of the rectangle, thus we find the rightmost index or the leftmost index with the provided conditions.We do this for all i hence the complexity is O(N2). I will explain the O(N * log(N) solution that uses sorting and segment tree at the very end after providing you with the working c++ code for this one. So here goes the code for you.
#include <bits/stdc++.h> // imports all necessary headers
using namespace std;
inline int getMaxPond(int* arr, int size)
{
int ans = INT_MIN;
for(int i = 0; i < size; i++)
{
int right = -1, left = -1;
for(int j = i + 1; j < size;
j++)
{
if(arr[j] >=
arr[i])
right = j;
}
for(int k = i - 1; k >= 0;
k--)
{
if(arr[k] >=
arr[i])
left = k;
}
if(right != -1 && left !=
-1)
{
int a1 = (right
- i) * arr[i];
int a2 = (i -
left) * arr[i];
ans = max(ans,
max(a1, a2));
}
if(right == -1 && left !=
-1)
{
int a2 = (i -
left) * arr[i];
ans = max(ans,
a2);
}
if(right != -1 && left ==
-1)
{
int a1 = (right
- i) * arr[i];
ans = max(ans,
a1);
}
}
if(ans == INT_MIN)
return 0;
return ans;
}
int main()
{
int n;
cin >> n;
int arr[n];
for(int i = 0; i < n; i++)
cin >> arr[i];
cout << getMaxPond(arr, n) <<
endl;
return 0;
}
This solution works in O(N2) and would not work for
large N. So we have to come up with a simple optimization. So we
have to fix every "i", this cannot be changed, but the extra
complexity adds up when we want to find out the rightmost index
following the inequality arr[j] >= arr[i]. So to remove the
extra N from the complexity we have to come up with something
clever. Let us first create a copy of the given array and sort the
copied array keeping track of the indices with the sorted array.
That is, use a vector of pairs and keep the first element of the
pair as the value of the array and the second element of the pair
as its index and then sort the array. Now build a segment tree
based on the sorted index (not the value, that is the second
element of the pair). Once we have done these things start
traversing the original array, then use binary search on the second
array to find an element just greater than the current element and
find its position ON the array. Use the segment tree to find the
largest index and carry out this process for all the indices.
The second method is a bit tough to explain and code but if you want better complexity you have to come up with tricky ideas. Maybe easier ideas exist and i am not thinking clear but i think the given code and this algorithm will work too. The code passes all the given test cases and is clearly written. However if still problem persists just hit me up in the comment section below anytime and i will be more than happy to help you out.
Thank you.
Add Answer to:
The elevation profile for the above plot of land is [1, 2, 3, 1, 2,1,4, 8, 2, 2, 2, 0]. One can f...
How would answer question #4 of this ? #1 and 2 #include<iostream> #include <fstream> using namespace...
 How would answer question #4 of this ?
#1 and 2
#include<iostream>
#include <fstream>
using namespace std;
void read(int arr[])
{
string line;
ifstream myfile("input.txt");
int i = 0;
if (myfile.is_open())
{
while (getline(myfile, line))
{
arr[i];
i++;
}
myfile.close();
}
}
void output(int arr[])
{
ofstream myfile("output.txt");
if (myfile.is_open())
{
int i = 0;...
How would answer question #4 of this ?
#1 and 2
#include<iostream>
#include <fstream>
using namespace std;
void read(int arr[])
{
string line;
ifstream myfile("input.txt");
int i = 0;
if (myfile.is_open())
{
while (getline(myfile, line))
{
arr[i];
i++;
}
myfile.close();
}
}
void output(int arr[])
{
ofstream myfile("output.txt");
if (myfile.is_open())
{
int i = 0;...
The Fibonacci sequence is the sequence of numbers: 0, 1, 1, 2, 3, 5, 8, 13,...
The Fibonacci sequence is the sequence of numbers: 0, 1, 1, 2, 3, 5, 8, 13, 21, 34, … The next number is found by adding up the two numbers before it. For example, the 2 is found by adding the two numbers before it (1+1). The 3 is found by adding the two numbers before it (1+2). The 5 is found by adding the two numbers before it (2+3), and so on! Each number in the sequence is called...
A road's profile is given by the function 30 +22, for 0 sx 15, where x is the 40 25 horizontal distance in miles, and y is the elevation in feet above sea level. 20 15 10 2 4 6 8 10 12 14 FOR THE...
 A road's profile is given by the function 30 +22, for 0 sx 15, where x is the 40 25 horizontal distance in miles, and y is the elevation in feet above sea level. 20 15 10 2 4 6 8 10 12 14 FOR THE FOLLOWING PROBLEMS, USE AT LEAST 3 DECIMAL PLACES OF PRECISION FOR COMPUTATIONS, BUT REPORT FINAL ANSWERS TO 1 DECIMAL PLACE. a) Determine the average elevation of the road over the interval 0sx 515. Find...
Problem 1. (75') This is a 1-D steady state problem. Only object A generates heat per unit volume of dA 2 x 10⁶W/m3. The left surface of A is insulated and the right surface of B is exposed to a...
 Problem 1. (75') This is a 1-D steady state problem. Only object A generates heat per unit volume of dA 2 x 10⁶W/m3. The left surface of A is insulated and the right surface of B is exposed to a fluid. Temperature of the fluid is To 300 K. The convective heat transfer coefficient is h 1000 W/m2/K Thermal conductivity of A is kA 30 W/m/K, and B is k 20 W/m/K Thickness of each object is: IA-30 mm, 1':...
3. (10 points) A solid of revolution V has a volume of 4 cubic units and cross-sectional slices of area A(2), where x ranges frorn 0 to 1 . The graph of A(z) İs given below, along with the graphs...
 3. (10 points) A solid of revolution V has a volume of 4 cubic units and cross-sectional slices of area A(2), where x ranges frorn 0 to 1 . The graph of A(z) İs given below, along with the graphs of three other functions. Which one is the graph of A()? Justify your answer (a) y (c) yt (d) y 0 -6 0
3. (10 points) A solid of revolution V has a volume of 4 cubic units and cross-sectional...
3. (10 points) A solid of revolution V has a volume of 4 cubic units and cross-sectional slices of area A(2), where x ranges frorn 0 to 1 . The graph of A(z) İs given below, along with the graphs of three other functions. Which one is the graph of A()? Justify your answer (a) y (c) yt (d) y 0 -6 0
3. (10 points) A solid of revolution V has a volume of 4 cubic units and cross-sectional...
8. Consider the production function Q = (-1/2 + K1/2)2/3, where L denotes labor and K...
 8. Consider the production function Q = (-1/2 + K1/2)2/3, where L denotes labor and K denotes capital. How many of the following statements are true for this production function? • Production exhibits increasing returns to scale. • For each additional unit of labor, the firm must give up decreasing amounts of capital to maintain output. If the firm is currently using 2 units of labor and 8 units of capital, then according to the MRTS it can trade 2...
Mountain Paths (Part 1) Objectives 2d arrays Store Use Nested Loops Parallel data structures (i.e...
Mountain Paths (Part 1) in C++ Objectives 2d arrays Store Use Nested Loops Parallel data structures (i.e. parallel arrays … called multiple arrays in the zyBook) Transform data Read from files Write to files structs Code Requirements Start with this code: mtnpathstart.zip Do not modify the function signatures provided. Do not #include or #include Program Flow Read the data into a 2D array Find min and max elevation to correspond to darkest and brightest color, respectively Compute the shade of...
Mountain Paths (Part 1) in C++ Objectives 2d arrays Store Use Nested Loops Parallel data structures...
Mountain Paths (Part 1) in C++ Objectives 2d arrays Store Use Nested Loops Parallel data structures (i.e. parallel arrays … called multiple arrays in the zyBook) Transform data Read from files Write to files structs Code Requirements Start with this code: mtnpathstart.zip Do not modify the function signatures provided. Do not #include or #include Program Flow Read the data into a 2D array Find min and max elevation to correspond to darkest and brightest color, respectively Compute the shade of...
Let f be the function defined by F(x)=(1/2)(x+2)^2 for [-2,0) and 2-2sin(sqrtx) for [0, (x^3)/4]. the...
 Let
f be the function defined by F(x)=(1/2)(x+2)^2 for [-2,0) and
2-2sin(sqrtx) for [0, (x^3)/4]. the graph of f is shown in the
figure above. Let R be the regiok bounded by the graph of f and the
x-axis.
for -25=co for osca Let I be the function defined by 1 (2) - {}(2+2) (2-2n The graph of fis shown in the figure above. Let R be the region bounded by the graph off and the ads (a) Find the...
Let
f be the function defined by F(x)=(1/2)(x+2)^2 for [-2,0) and
2-2sin(sqrtx) for [0, (x^3)/4]. the graph of f is shown in the
figure above. Let R be the regiok bounded by the graph of f and the
x-axis.
for -25=co for osca Let I be the function defined by 1 (2) - {}(2+2) (2-2n The graph of fis shown in the figure above. Let R be the region bounded by the graph off and the ads (a) Find the...
Can some one fix my code so that the output result same as below? BAR PLOT...
Can some one fix my code so that the output result same as below? BAR PLOT OF CYLINDER PRESSURE -VS- TIME pressure is on horizontal axis - units are psi time is on vertical axis - units are msec 0.0 20.0 40.0 60.0 80.0 100.0 120.0 +---------+---------+---------+---------+---------+---------+ 0.0|************************* 1.5|********************************* 3.0|***************************************** 4.4|************************************************** 05.9|********************************************* 7.4|******************************** 8.9|*********************** 10.4|***************** 11.9|************** 13.3|************* 14.8|************ 16.3|********* 17.8|******* 19.3|****** 20.7|****** 22.2|******* 23.7|******* .......... ===================== her is my code //#include"stdafx.h" #include #include #include #include #include #include using...
 How would answer question #4 of this ?
#1 and 2
#include<iostream>
#include <fstream>
using namespace std;
void read(int arr[])
{
string line;
ifstream myfile("input.txt");
int i = 0;
if (myfile.is_open())
{
while (getline(myfile, line))
{
arr[i];
i++;
}
myfile.close();
}
}
void output(int arr[])
{
ofstream myfile("output.txt");
if (myfile.is_open())
{
int i = 0;...
How would answer question #4 of this ?
#1 and 2
#include<iostream>
#include <fstream>
using namespace std;
void read(int arr[])
{
string line;
ifstream myfile("input.txt");
int i = 0;
if (myfile.is_open())
{
while (getline(myfile, line))
{
arr[i];
i++;
}
myfile.close();
}
}
void output(int arr[])
{
ofstream myfile("output.txt");
if (myfile.is_open())
{
int i = 0;...
 A road's profile is given by the function 30 +22, for 0 sx 15, where x is the 40 25 horizontal distance in miles, and y is the elevation in feet above sea level. 20 15 10 2 4 6 8 10 12 14 FOR THE FOLLOWING PROBLEMS, USE AT LEAST 3 DECIMAL PLACES OF PRECISION FOR COMPUTATIONS, BUT REPORT FINAL ANSWERS TO 1 DECIMAL PLACE. a) Determine the average elevation of the road over the interval 0sx 515. Find...
 Problem 1. (75') This is a 1-D steady state problem. Only object A generates heat per unit volume of dA 2 x 10⁶W/m3. The left surface of A is insulated and the right surface of B is exposed to a fluid. Temperature of the fluid is To 300 K. The convective heat transfer coefficient is h 1000 W/m2/K Thermal conductivity of A is kA 30 W/m/K, and B is k 20 W/m/K Thickness of each object is: IA-30 mm, 1':...
 3. (10 points) A solid of revolution V has a volume of 4 cubic units and cross-sectional slices of area A(2), where x ranges frorn 0 to 1 . The graph of A(z) İs given below, along with the graphs of three other functions. Which one is the graph of A()? Justify your answer (a) y (c) yt (d) y 0 -6 0
3. (10 points) A solid of revolution V has a volume of 4 cubic units and cross-sectional...
3. (10 points) A solid of revolution V has a volume of 4 cubic units and cross-sectional slices of area A(2), where x ranges frorn 0 to 1 . The graph of A(z) İs given below, along with the graphs of three other functions. Which one is the graph of A()? Justify your answer (a) y (c) yt (d) y 0 -6 0
3. (10 points) A solid of revolution V has a volume of 4 cubic units and cross-sectional...
 8. Consider the production function Q = (-1/2 + K1/2)2/3, where L denotes labor and K denotes capital. How many of the following statements are true for this production function? • Production exhibits increasing returns to scale. • For each additional unit of labor, the firm must give up decreasing amounts of capital to maintain output. If the firm is currently using 2 units of labor and 8 units of capital, then according to the MRTS it can trade 2...
 Let
f be the function defined by F(x)=(1/2)(x+2)^2 for [-2,0) and
2-2sin(sqrtx) for [0, (x^3)/4]. the graph of f is shown in the
figure above. Let R be the regiok bounded by the graph of f and the
x-axis.
for -25=co for osca Let I be the function defined by 1 (2) - {}(2+2) (2-2n The graph of fis shown in the figure above. Let R be the region bounded by the graph off and the ads (a) Find the...
Let
f be the function defined by F(x)=(1/2)(x+2)^2 for [-2,0) and
2-2sin(sqrtx) for [0, (x^3)/4]. the graph of f is shown in the
figure above. Let R be the regiok bounded by the graph of f and the
x-axis.
for -25=co for osca Let I be the function defined by 1 (2) - {}(2+2) (2-2n The graph of fis shown in the figure above. Let R be the region bounded by the graph off and the ads (a) Find the...
Most questions answered within 3 hours.
-
Where is the error in this code sequence?
String s1 = "Hello";
String s2 = "ello";...
asked 11 months ago -
Financial data for Joel de Paris, Inc., for last year
follow:
Joel de Paris, Inc.
Balance...
asked 11 months ago -
Consider this reaction:
Al2(SO4)3 (aq)+ BaCl3
(aq) Al2Cl6 (aq)- +
3BaSO4(s) . What is the...
asked 11 months ago -
Suppose that Savneet is considering increasing her
recent random sample from 20 car rentals to 40...
asked 11 months ago -
Trucks arrive at an unloading terminal at an average rate of 120
per hour.
Trucks arrive...
asked 11 months ago -
Why are methanol and ethanol completely soluble in water while
octanol is not very little soluble....
asked 11 months ago -
A facilities manager at a university reads in a research report
that the mean amount of...
asked 11 months ago -
When the CuSO4 is rehydrated by adding water to the anhydrous
compound, is this an endothermic...
asked 11 months ago -
A ray of sunlight is passing from diamond into crown glass; the
angle of incidence is...
asked 11 months ago -
A block of mass 0.249 kg is placed on top of a light, vertical
spring of...
asked 11 months ago -
how do the kidneys compensate in the presences of acidosis
a) trigger hyperventilate
b) reserve acid...
asked 11 months ago -
Question 501 pts
The rental rate of capital to the firm increases. Which of the
following...
asked 11 months ago