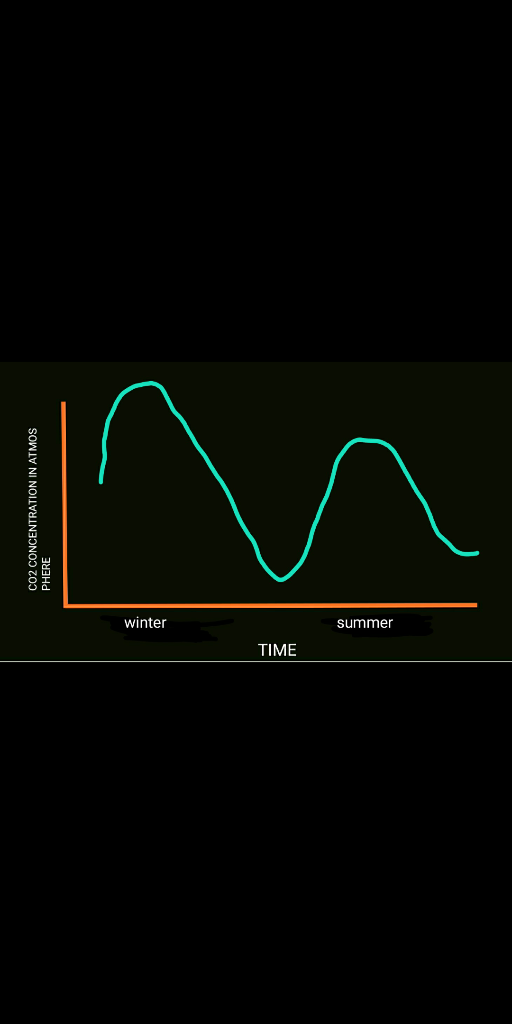
The curve in the following figure shows the measurement of the concentration of carbon dioxide in a place where bonfires are being held.

A. What can be concluded from the graph on the concentration of
carbon dioxide?
B. What does the increase stem from? Explain your answer.
C. What does the decrease stem from? Explain your answer.
D. Draw a curve showing the concentration of carbon dioxide in the same place on a normal day. Explain the illustration. What can cause changes in the concentration of carbon dioxide in the air? Explain.
E. Draw the concentration of carbon dioxide in a city throughout the year. Explain your illustration.
Thank you!!!
Homework Answers
A. From the graph, we can see that CO2 concentratoon initially increases and reach a peak at around 17 hours in the evening. It means bonfires in that area are used in the evening maainly. This may be due to following reasons -
1. In the city, the temperature in the evening may significantly fall down when the sun is not over the head. People use this to warm themselves.
2. People who may travel from one place to another may use bonfires to locate lanes.
B. Increasing stem depicts the concentration of CO2 of areas which either use less bonfires normally or use less bonfires when the sun is over the head.
C. Decreasing stem depicts the concentration of CO2 of areas where people stop using bonfires at night when they go to sleep. You may notice that decreasing stem is morr gradual as compared to increasing stem. This may be due to use of bonfires by travellers at night or by people living in slums.
One more possible reason for B and C is that, bonfires take some to reach their maxima. People start there bonfires at around 12 hours in the afternoon and the bonfire reaches peak at 17 hours. At this time the concentration of CO2 is maximum. Then the bonfire starts to decrease in its intensity and reaches least at around 6 hours.
D. We can assume that people living in cold areas use bonfires. So, the graph given to us is for a cold area which uses bonfires. If the area does not use bonfires, then the graph would be like -

In a cold region (or when temperature is low), plant photosynthesize minimally so, CO2 concentration is high in atmosphere during day. At night, stomata in plants closes so, even less photosynthesis is there and there will be morr CO2 in night than day.
This graph is made ignoring all other factors (bonfires, combustion of fuel, pollution etc.)
E. Through out the area, when there are winters, CO2 concentration will be high. Because at cold temperature, plants minimize photosynthesis, uptake less CO2 from environment and so the atmospheric CO2 concentration is high.
Conversely, plants maximixe photosynthesis in summer and take up more CO2 from the atmosphere. So, CO2 concentration in environment is less.
Please rate.
Add Answer to:
The curve in the following figure shows the measurement of the concentration of carbon dioxide in...
Air pollution control specialists monitor the amount of ozone, carbon dioxide, and nitrogen dioxide in the...
Air pollution control specialists monitor the amount of ozone, carbon dioxide, and nitrogen dioxide in the air on a daily basis. Throughout the first weekend of November the specialists recorded the levels of nitrogen dioxide every 3 hours (i.e. at 12am/pm, 3am/pm, 6am/pm, 9am/pm) each day. Day Hour NO2 Level 1-Nov 12:00 AM 35 3:00 AM 25 6:00 AM 32 9:00 AM 45 12:00 PM 40 3:00 PM 25 6:00 PM 36 9:00 PM 50 2-Nov 12:00 AM 42 3:00...
As of October 4, 2017, the measured concentration of atmospheric carbon dioxide (CO2 in Air) is...
As of October 4, 2017, the measured concentration of atmospheric carbon dioxide (CO2 in Air) is 616 ppm by mass. This measurement is taken from the Mauna Loa observatory on the Big Island of Hawai’i. Consider that 616 ppm means air is 0.0616 % CO2 by mass (mass CO2/mass air). Calculate the mass of CO2, in micrograms, in 1.00 cubic foot of air. i dont understand the steps. could someone explain the steps and not just show the steps
Compare the concentration (mg/L) of carbon dioxide in a canal in Boca T=25, P= 1 atm...
Compare the concentration (mg/L) of carbon dioxide in a canal in Boca T=25, P= 1 atm to a river in the mountains T=10C and elevation 1000 m if the concentration is in the atmosphere was 275 ppm. If global carbon dioxide increases to 450 ppm, how does this change? What happens to the water from a pH perspective?
Draw the demand curve for an environmental service, for example carbon sequestration (process of capture and...
Draw the demand curve for an environmental service, for example carbon sequestration (process of capture and long-term storage of atmospheric carbon-dioxide) from tree planting and discuss what its slope means as a measure of willingness to pay for the service (explain the direction of slope). Label the axes on your graphs clearly.
Concentration of CO2 in the Atmosphere Levels of carbon dioxide (CO2) in the atmosphere are rising...
 Concentration of CO2 in the Atmosphere Levels of carbon dioxide (CO2) in the atmosphere are rising rapidly, far above any levels ever before recorded. Levels were around 278 parts per million in 1800, before the Industrial Age, and had never, in the hundreds of thousands of years before that, gone above 300 ppm. Levels are now nearing 400 ppm. Table 1 shows the rapid rise of CO2 concentrations over the last 50 years, also available in CarbonDioxide.1 We can use...
please, i need help as soon as possible. please, i need help as soon as possible....
 please, i need help as soon as possible.
B- AutoSave Of H File Home Insert Assignment2 (1) - Excel Page Layout Formulas Data Parta Draw fo Review A1 x 1 Parta 2 Pattern: Time Series Plot SUSAN 19 Part 6 20 Regression Model: 21 Estimated Nitrogen Dioxide 9-10am: 22 Estimated Nitrogen Dioxide 3-4pm: 24. Part 25 Regression Model: 26 Estimated Nitrogen Dioxide 9-10am: 27 Estimated Nitrogen Dioxide 3-4pm: 29 Part 01 02...
please, i need help as soon as possible.
please, i need help as soon as possible.
B- AutoSave Of H File Home Insert Assignment2 (1) - Excel Page Layout Formulas Data Parta Draw fo Review A1 x 1 Parta 2 Pattern: Time Series Plot SUSAN 19 Part 6 20 Regression Model: 21 Estimated Nitrogen Dioxide 9-10am: 22 Estimated Nitrogen Dioxide 3-4pm: 24. Part 25 Regression Model: 26 Estimated Nitrogen Dioxide 9-10am: 27 Estimated Nitrogen Dioxide 3-4pm: 29 Part 01 02...
Suplementary Questions Carbon Dioxide Conclusions 1. Can a candle burn in carbon dioxide? Does ca...
 Suplementary Questions Carbon Dioxide Conclusions 1. Can a candle burn in carbon dioxide? Does carbon dioxide burn? 2. What happened to the burning candle? Could carbon dioxide be used as a fire extinguisher? 3. Why should you release the carbon dioxide into the bottom of the cup? Hydrogen Conclusions 1. What difference did you notice between Parts 1 and 2 in the hydrogen experiment? Explain. 2. What is the purpose of the soap solution? 3. Why should extreme care be...
Q11. Which of the following reason can explain that carbon dioxide is considered as an important...
Q11. Which of the following reason can explain that carbon dioxide is considered as an important factor for climate change? A.carbon dioxide absorbs water vapor B.carbon dioxide react with water vapor C.carbon dioxide absorbs infrared radiation D.carbon dioxide can be broken down as carbon atoms and oxygen molecules by ultraviolet radiation, then the carbon burns with the oxygen. - Q12. Which of the following statements is NOT true? A.Atmosphere is NOT well-mixed from bottom to top. B.Atmospheric pressure decreases with...
When a plant grows, the atoms used come from carbon dioxide in the air and water....
When a plant grows, the atoms used come from carbon dioxide in the air and water. Plants are able to accomplish this through the process of photosynthesis, cellular respiration and biosynthesis of macromolecules. Briefly explain the light-independent reactions of photosynthesis: where does this take place, what are the reactants and what is produced? How do plants store excess product from these reactions?
The following plot shows the plasma concentration versus time observed from the administration of 10 mg...
 The following plot shows the plasma concentration versus time observed from the administration of 10 mg IV-Bolus of Drug-A. What is approximately the half-life of Drug-A in this subject? 200.0 180.0 160.0 140.0 120.0 100.0 80.0 60.0 0.0 20.0 0.0 0 12 34 5 6789 10 11 12 13 14 15 16 17 18 19 20 21 22 23 24 25 26 Time (hours)
 Concentration of CO2 in the Atmosphere Levels of carbon dioxide (CO2) in the atmosphere are rising rapidly, far above any levels ever before recorded. Levels were around 278 parts per million in 1800, before the Industrial Age, and had never, in the hundreds of thousands of years before that, gone above 300 ppm. Levels are now nearing 400 ppm. Table 1 shows the rapid rise of CO2 concentrations over the last 50 years, also available in CarbonDioxide.1 We can use...
 please, i need help as soon as possible.
B- AutoSave Of H File Home Insert Assignment2 (1) - Excel Page Layout Formulas Data Parta Draw fo Review A1 x 1 Parta 2 Pattern: Time Series Plot SUSAN 19 Part 6 20 Regression Model: 21 Estimated Nitrogen Dioxide 9-10am: 22 Estimated Nitrogen Dioxide 3-4pm: 24. Part 25 Regression Model: 26 Estimated Nitrogen Dioxide 9-10am: 27 Estimated Nitrogen Dioxide 3-4pm: 29 Part 01 02...
please, i need help as soon as possible.
please, i need help as soon as possible.
B- AutoSave Of H File Home Insert Assignment2 (1) - Excel Page Layout Formulas Data Parta Draw fo Review A1 x 1 Parta 2 Pattern: Time Series Plot SUSAN 19 Part 6 20 Regression Model: 21 Estimated Nitrogen Dioxide 9-10am: 22 Estimated Nitrogen Dioxide 3-4pm: 24. Part 25 Regression Model: 26 Estimated Nitrogen Dioxide 9-10am: 27 Estimated Nitrogen Dioxide 3-4pm: 29 Part 01 02...
 Suplementary Questions Carbon Dioxide Conclusions 1. Can a candle burn in carbon dioxide? Does carbon dioxide burn? 2. What happened to the burning candle? Could carbon dioxide be used as a fire extinguisher? 3. Why should you release the carbon dioxide into the bottom of the cup? Hydrogen Conclusions 1. What difference did you notice between Parts 1 and 2 in the hydrogen experiment? Explain. 2. What is the purpose of the soap solution? 3. Why should extreme care be...
 The following plot shows the plasma concentration versus time observed from the administration of 10 mg IV-Bolus of Drug-A. What is approximately the half-life of Drug-A in this subject? 200.0 180.0 160.0 140.0 120.0 100.0 80.0 60.0 0.0 20.0 0.0 0 12 34 5 6789 10 11 12 13 14 15 16 17 18 19 20 21 22 23 24 25 26 Time (hours)
Most questions answered within 3 hours.
-
Where is the error in this code sequence?
String s1 = "Hello";
String s2 = "ello";...
asked 11 months ago -
Financial data for Joel de Paris, Inc., for last year
follow:
Joel de Paris, Inc.
Balance...
asked 11 months ago -
Consider this reaction:
Al2(SO4)3 (aq)+ BaCl3
(aq) Al2Cl6 (aq)- +
3BaSO4(s) . What is the...
asked 11 months ago -
Suppose that Savneet is considering increasing her
recent random sample from 20 car rentals to 40...
asked 11 months ago -
Trucks arrive at an unloading terminal at an average rate of 120
per hour.
Trucks arrive...
asked 11 months ago -
Why are methanol and ethanol completely soluble in water while
octanol is not very little soluble....
asked 11 months ago -
A facilities manager at a university reads in a research report
that the mean amount of...
asked 11 months ago -
When the CuSO4 is rehydrated by adding water to the anhydrous
compound, is this an endothermic...
asked 11 months ago -
A ray of sunlight is passing from diamond into crown glass; the
angle of incidence is...
asked 11 months ago -
A block of mass 0.249 kg is placed on top of a light, vertical
spring of...
asked 11 months ago -
how do the kidneys compensate in the presences of acidosis
a) trigger hyperventilate
b) reserve acid...
asked 11 months ago -
Question 501 pts
The rental rate of capital to the firm increases. Which of the
following...
asked 11 months ago