The figure below depicts the aggregate demand curve (AD) and the long-run aggregate supply curve (LRAS) for the United States. The economy is initially at long-run equilibrium, at point A.
The figure below depicts the aggregate demand curve (AD) and the long-run aggregate supply curve (LRAS) for the United States. The economy is initially at long-run equilibrium, at point A.
One of the most contentious issues among economists involves the economy’s adjustment to long-run equilibrium. Some economists believe that adjustment can and should occur naturally. This group, the classical economists, stresses the importance of aggregate supply. Others see the return to long-run equilibrium as an adjustment that occurs unpredictably and often with much delay. This group, the Keynesian economists, stresses the importance of aggregate demand and calls for the government to speed the process back to full employment.
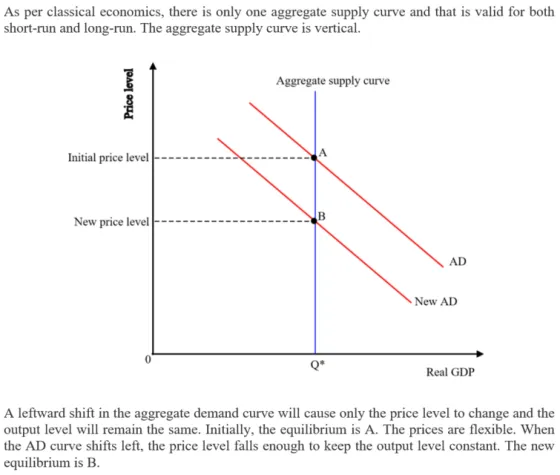
One tenet of classical economics is the assumption that prices are flexible throughout the economy. If prices are completely flexible, then the economy is essentially self-correcting: no matter what factors change in the economy, no matter what curves shift, the economy automatically comes back to full-employment GDP.
Suppose the economy now faces a recession caused by a collapse of the stock market that is also matched by a fall in expected future income. This situation would be represented by a shift of the AD curve to the left, due to a significant drop in consumption expenditure. AD2 is the new AD curve that depicts the fall in consumption expenditure.
According to classical economics, the economy will self-correct and recover from the recession on its own without government intervention. Use the figure below to depict the self-correction of the economy following the leftward shift of the AD curve. Note that this question is specifically asking you to evaluate this scenario as a classical economist. Therefore, you must determine whether you need to drag the curves or whether you need to use the point tool to mark the new equilibrium without shifting any curves.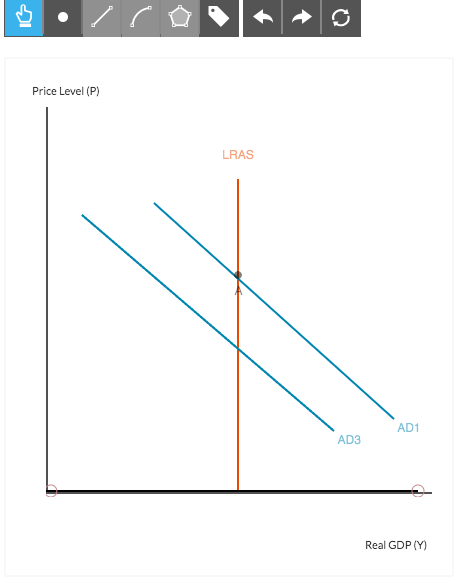
I tried shifting AD3 to the left, but was incorrect
Homework Answers
Add Answer to:
The figure below depicts the aggregate demand curve (AD) and the long-run aggregate supply curve (LRAS) for the United States. The economy is initially at long-run equilibrium, at point A.
The figure below depicts the aggregate demand curve (AD), the short-run aggregate supply curve (SRAS), and the long-run aggregate supply curve (LRAS) for the United States. The economy is initially at long-run equilibrium, at point A.
 The figure below depicts the aggregate demand curve (AD), the short-run aggregate supply curve (SRAS), and the long-run aggregate supply curve (LRAS) for the United States. The economy is initially at long-run equilibrium, at point A.One of the most contentious issues among economists involves the economy’s adjustment to long-run equilibrium. Some economists believe that adjustment can and should occur naturally. This group, the classical economists, stress the importance of aggregate supply. Others see the return to long-run equilibrium as an...
The following figure depicts the aggregate demand (AD), theshort-run aggregate supply (SRAS), and the long-run...
 The following figure depicts the aggregate demand (AD), the
short-run aggregate supply (SRAS), and the long-run aggregate
supply (LRAS) curves for an economy. The economy is initially at
long-run equilibrium, at point A. Suppose that there is an increase
in the amount of investment in the economy due to a reduction in
the real interest rate. This increase in investment shifts the AD
curve to the right, depicted below in the movement of the economy
from point A to point...
The following figure depicts the aggregate demand (AD), the
short-run aggregate supply (SRAS), and the long-run aggregate
supply (LRAS) curves for an economy. The economy is initially at
long-run equilibrium, at point A. Suppose that there is an increase
in the amount of investment in the economy due to a reduction in
the real interest rate. This increase in investment shifts the AD
curve to the right, depicted below in the movement of the economy
from point A to point...
Figure: AD–AS Refer to Figure: AD–AS. Assume that the economy is in long-run equilibrium. If the...
 Figure:
AD–AS
Refer to Figure: AD–AS. Assume that the economy
is in long-run equilibrium. If the Federal Reserve were to lower
the targeted federal funds rate we would most likely expect:
there will be a downward movement along the aggregate demand
curve AD1.
the aggregate demand curve will stay unchanged at
AD1.
the aggregate demand curve will shift to
AD3.
the aggregate demand curve will shift to
AD2.
LRAS Aggregate price level SRAS AD, AD AD, Y₂ YpY, Real GDP
Figure:
AD–AS
Refer to Figure: AD–AS. Assume that the economy
is in long-run equilibrium. If the Federal Reserve were to lower
the targeted federal funds rate we would most likely expect:
there will be a downward movement along the aggregate demand
curve AD1.
the aggregate demand curve will stay unchanged at
AD1.
the aggregate demand curve will shift to
AD3.
the aggregate demand curve will shift to
AD2.
LRAS Aggregate price level SRAS AD, AD AD, Y₂ YpY, Real GDP
Using the aggregate demand (AD), the short-run aggregate supply (SRAS), and the long-run aggregate supply (LRAS)...
Using the aggregate demand (AD), the short-run aggregate supply (SRAS), and the long-run aggregate supply (LRAS) curves, briefly explain how an open market purchase will affect the equilibrium price level (P) and real output (Y) in the short run. Assume the economy is initially in a recession?
Unit 3: Aggregate Demand, Aggregate Supply, and Fiscal Policy AD, AS, and LRAS Short Run vs....
 Unit 3: Aggregate Demand, Aggregate Supply, and Fiscal Policy AD, AS, and LRAS Short Run vs. Long Run Aggregate Supply Draw the economy at full employment 1. In the short run, wages and resource prices will as price levels increase 2. In the long run, wages and resource prices will as price levels increase Shifters of AD and AS Shifters of Aggregate Demand Shifters of Aggregate Supply imi Recessionary Gap Draw an economy in a recession Inflationary Gap Draw an...
Using aggregate demand (AD), short-run aggregate supply (SRAS) and long-run aggregate supply (LRAS) curves
Question 1: AD-SRAS-LRAS Model Using aggregate demand (AD), short-run aggregate supply (SRAS) and long-run aggregate supply (LRAS) curves, graphically illustrate the effect of an increase in the money supply on output and prices in the short and long run. Assume that the economy is initially in long run equilibrium at the potential output level and prices are fixed in the short-run. In your graph, label "A" for the initial equilibrium, "B' for the short-run equilibrium, and "C" for the long-run equilibrium.
The following graph shows the short-run aggregate supply curve (AS), the aggregate demand curve (AD), and the long-run aggregate supply curve (LRAS) for a hypothetical economy
 9. Economic fluctuations II The following graph shows the short-run aggregate supply curve (AS), the aggregate demand curve (AD), and the long-run aggregate supply curve (LRAS) for a hypothetical economy. Initially, the expected price level is equal to the actual price level, and the economy is in long-run equilibrium at its natural level of output, $120 billion. Suppose a bout of severe weather drives up agricultural costs, increases the costs of transporting goods and services, and increases the costs of producing goods...
14 Question (1 point) The following figure depicts the aggregate demand curve (AD), the short-run aggregate...
 14 Question (1 point) The following figure depicts the aggregate demand curve (AD), the short-run aggregate supply curve (SRAS), and the long-run aggregate supply curve (LRAS) for the United States. The economy is initially at long-run equilibrium, at point A. In addition to the crash of the stock market and a subsequent fall in expected future income, the Great Depression was also partially caused by a change in legislation regarding trade. In 1930, Congress passed the Smoot-Hawley Tariff Act. This...
Economics chart The following graph shows the economy in long-run equilibrium at the price level of...
 Economics chart The following graph shows the economy in long-run equilibrium at the price level of 120 and potential output of $300 billion. Suppose several foreign economies experience severe recessions, causing foreign purchases of domestic goods and services to decline sharply. Shift the short-run aggregate supply (AS) curve or the aggregate demand (AD) curve to show the short-run impact of the economic turmoil abroad. Tool tip: Click and drag one or both of the curves. Curves will snap into position, so if...
drawing the graph of AD (Aggregate Demand), SRAS (Short- run aggregate supply curve) and LRAS (...
drawing the graph of AD (Aggregate Demand), SRAS (Short- run aggregate supply curve) and LRAS ( long run aggregate supply curve) and writing down what would happen under the two conditions "increase personal income taxes" and "decrease personal income taxes". You need to write down everything happens by following the seven steps: 1. What would happen under the condition? (Whether AD, SRAS, or LRAS would change? And in which direction the curve would shift?) 2. Where is the new short-run...
 The following figure depicts the aggregate demand (AD), the
short-run aggregate supply (SRAS), and the long-run aggregate
supply (LRAS) curves for an economy. The economy is initially at
long-run equilibrium, at point A. Suppose that there is an increase
in the amount of investment in the economy due to a reduction in
the real interest rate. This increase in investment shifts the AD
curve to the right, depicted below in the movement of the economy
from point A to point...
The following figure depicts the aggregate demand (AD), the
short-run aggregate supply (SRAS), and the long-run aggregate
supply (LRAS) curves for an economy. The economy is initially at
long-run equilibrium, at point A. Suppose that there is an increase
in the amount of investment in the economy due to a reduction in
the real interest rate. This increase in investment shifts the AD
curve to the right, depicted below in the movement of the economy
from point A to point...
 Figure:
AD–AS
Refer to Figure: AD–AS. Assume that the economy
is in long-run equilibrium. If the Federal Reserve were to lower
the targeted federal funds rate we would most likely expect:
there will be a downward movement along the aggregate demand
curve AD1.
the aggregate demand curve will stay unchanged at
AD1.
the aggregate demand curve will shift to
AD3.
the aggregate demand curve will shift to
AD2.
LRAS Aggregate price level SRAS AD, AD AD, Y₂ YpY, Real GDP
Figure:
AD–AS
Refer to Figure: AD–AS. Assume that the economy
is in long-run equilibrium. If the Federal Reserve were to lower
the targeted federal funds rate we would most likely expect:
there will be a downward movement along the aggregate demand
curve AD1.
the aggregate demand curve will stay unchanged at
AD1.
the aggregate demand curve will shift to
AD3.
the aggregate demand curve will shift to
AD2.
LRAS Aggregate price level SRAS AD, AD AD, Y₂ YpY, Real GDP
 Unit 3: Aggregate Demand, Aggregate Supply, and Fiscal Policy AD, AS, and LRAS Short Run vs. Long Run Aggregate Supply Draw the economy at full employment 1. In the short run, wages and resource prices will as price levels increase 2. In the long run, wages and resource prices will as price levels increase Shifters of AD and AS Shifters of Aggregate Demand Shifters of Aggregate Supply imi Recessionary Gap Draw an economy in a recession Inflationary Gap Draw an...
 14 Question (1 point) The following figure depicts the aggregate demand curve (AD), the short-run aggregate supply curve (SRAS), and the long-run aggregate supply curve (LRAS) for the United States. The economy is initially at long-run equilibrium, at point A. In addition to the crash of the stock market and a subsequent fall in expected future income, the Great Depression was also partially caused by a change in legislation regarding trade. In 1930, Congress passed the Smoot-Hawley Tariff Act. This...
Most questions answered within 3 hours.
-
Where is the error in this code sequence?
String s1 = "Hello";
String s2 = "ello";...
asked 11 months ago -
Financial data for Joel de Paris, Inc., for last year
follow:
Joel de Paris, Inc.
Balance...
asked 11 months ago -
Consider this reaction:
Al2(SO4)3 (aq)+ BaCl3
(aq) Al2Cl6 (aq)- +
3BaSO4(s) . What is the...
asked 11 months ago -
Suppose that Savneet is considering increasing her
recent random sample from 20 car rentals to 40...
asked 11 months ago -
Trucks arrive at an unloading terminal at an average rate of 120
per hour.
Trucks arrive...
asked 11 months ago -
Why are methanol and ethanol completely soluble in water while
octanol is not very little soluble....
asked 11 months ago -
A facilities manager at a university reads in a research report
that the mean amount of...
asked 11 months ago -
When the CuSO4 is rehydrated by adding water to the anhydrous
compound, is this an endothermic...
asked 11 months ago -
A ray of sunlight is passing from diamond into crown glass; the
angle of incidence is...
asked 11 months ago -
A block of mass 0.249 kg is placed on top of a light, vertical
spring of...
asked 11 months ago -
how do the kidneys compensate in the presences of acidosis
a) trigger hyperventilate
b) reserve acid...
asked 11 months ago -
Question 501 pts
The rental rate of capital to the firm increases. Which of the
following...
asked 11 months ago